UX/UI Design | Product Design
Building a Scalable B2B Dashboard for a Creator Publishing Platform
Designing a lifecycle-based dashboard for campaign performance and royalties, reducing confusion and operational friction for revenue partners.
↓ 70% author support tickets
(~50 → ~15 per month)
Supporting outcomes:
- One-click royalties request.
- Lifecycle-adaptive dashboard views.
- Transparent revenue and royalty logic.
Key B2B
Financial Dashboard
Royalties system
Project overview
Product: Author Dashboard (Performance & Royalties)Company stage: Scale-upRole: UX/UI Designer — Lead DesignerPlatform: Web (Desktop-first usage)Status: Launched and iteratively improved
The project involved a full structural redesign of DashBook’s author dashboard — transforming a backend-driven interface into a scalable, lifecycle-based system focused on performance visibility, revenue clarity, and operational efficiency.
Product Context
DashBook was scaling from an early-stage startup into a multi-market publishing platform, managing 50+ active pre-sale campaigns and supporting over 200 published authors across France, Spain, and LATAM. Authors were not just users they were revenue partners. The business depended on their ability to run successful campaigns, reach a 150-book publication threshold, and continue generating royalties across multiple sales channels once published.
The dashboard was the operational core of this journey. During pre-sales, authors tracked momentum toward publication. After launch, they relied on it to monitor sales performance, royalties, and payouts. As the platform grew, it became clear that a single static dashboard structure could no longer support two fundamentally different lifecycle stages.
Problem
The Dashboard Didn’t Reflect the Author Lifecycle
As the company scaled across France, Spain, and LATAM, the system remained structurally unchanged treating all authors the same, regardless of their lifecycle stage. However, these were fundamentally different product states:
- During pre-sales, authors were focused on reaching 150 books sold within 44 days. They seek for visibility, momentum, and clarity around their publication target.
- Once published, they shifted to monitoring royalties, sales channels, and withdrawal timing.
The interface did not adapt to these changing needs. As a result:
- Performance metrics and financial data were mixed without hierarchy.
- Royalties were visible but not clearly actionable.
- The contractual royalty thresholds were technically present but conceptually unclear.
- Required manual processes for royalties withdrawal.
- Authors frequently contacted support to understand when and how they could withdraw earnings.
The system was functional — but not strategically designed around the author journey.
A single static structure attempted to serve multiple author states without differentiation
My Role
I led the complete redesign and re-implementation of DashBook’s Author Dashboard, replacing the legacy system with a new React-based product foundation. This was not an incremental update — we intentionally removed low-value legacy features (such as Calendar and Manuscripts) to rebuild the system around clarity, scalability, and financial logic. Working closely with the PM and engineering team, we made the strategic decision to start from scratch. I redefined the information architecture, separated performance tracking from financial management, and introduced a clear lifecycle structure for pre-sale and published authors.
Research & Insights
Insights emerged from recurring author conversations and direct collaboration with Customer Support, Business Developers, and Editors teams in continuous contact with authors at every stage of their journey.
By analyzing support tickets and operational patterns, we identified repeated confusion around royalties, sales tracking, and payout procedures particularly once books transitioned from pre-sale to publication.
I found out something critical: The dashboard did not evolve with the author publishing cycle.
Key Observations
Author priorities shift depending on lifecycle stage
- Pre-sale authors focused on momentum and campaign progress.
- Published authors focused on financial clarity and payout control.
Static dashboards fail in dynamic business models
A single structure could not support campaign tracking, revenue thresholds, multi-channel royalties, and payout management simultaneously.
Royalty threshold system was contractually defined but visually abstract
Authors didn’t understand:
- Where they currently stood
- What was needed to reach the next tier
Manual royalty processes increased uncertainty
Authors often contacted internal teams to understand when and how to withdraw royalties, indicating a lack of actionable clarity within the product itself.
Core Insight
The issue was not missing data. It was the absence of a lifecycle-aware structure and revenue clarity.
The dashboard needed to:
- Adapt to the author’s state.
- Clarify financial progression.
- Reduce dependency on human support.
- Increase trust in revenue transparency.
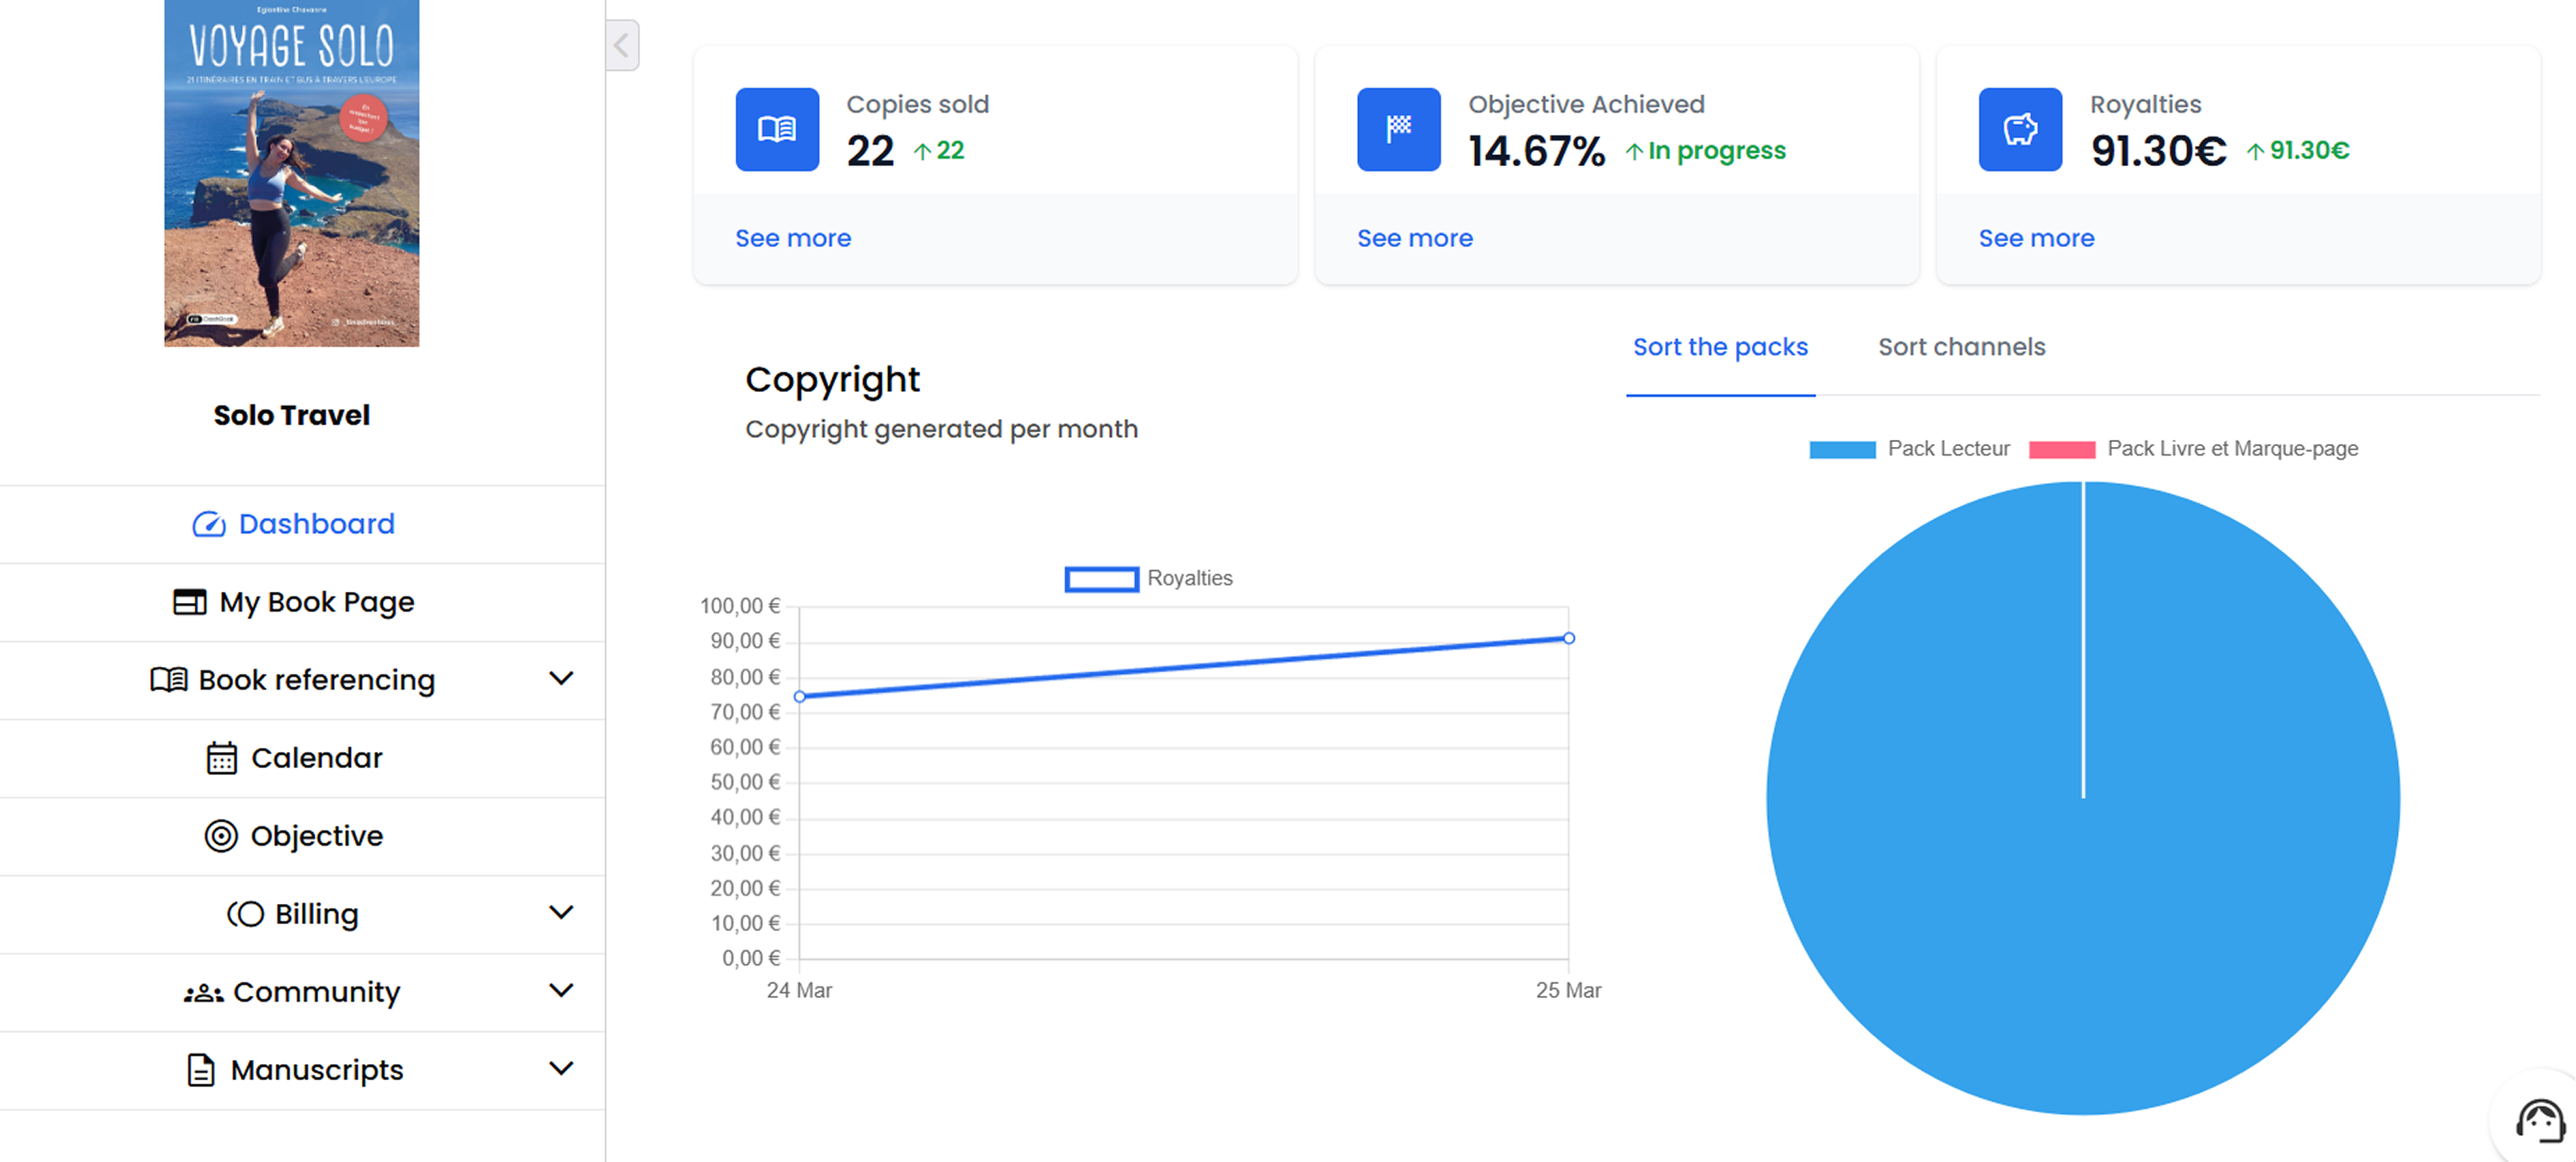
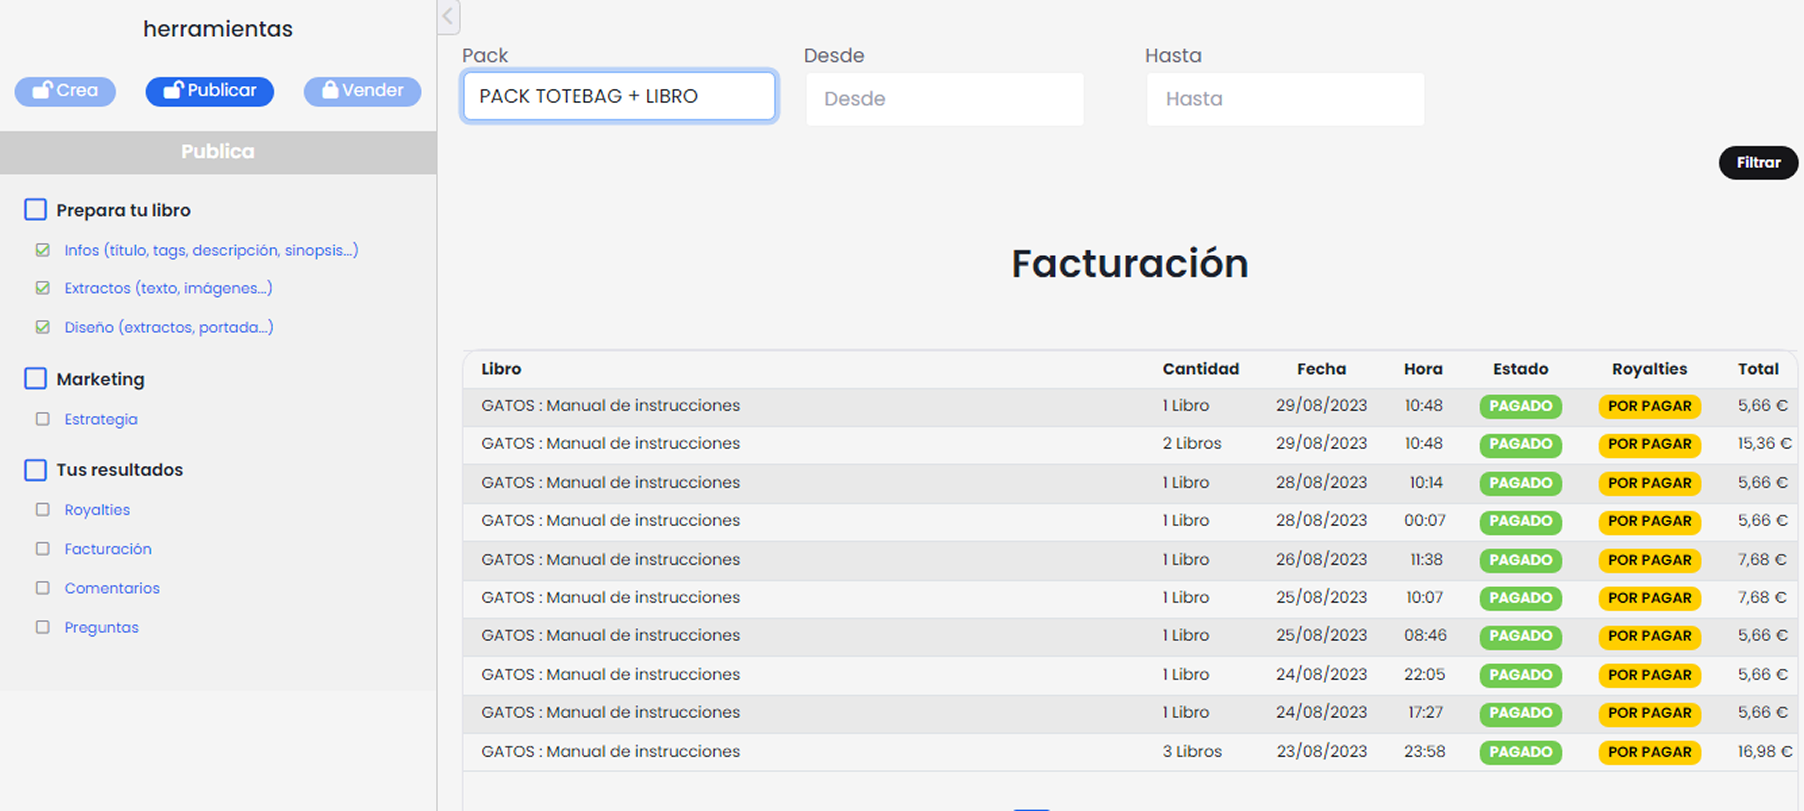
Legacy dashboard treating all authors equally, regardless of lifecycle stage, and mixing performance and financial data without contextual prioritization.
Design Strategy
Rethinking the Dashboard from the Ground Up
The legacy dashboard had grown around technical decisions rather than author needs, resulting in a fragmented structure that mixed performance, royalties, and secondary features without clear priorities. Instead of iterating on top of those constraints, we rebuilt the dashboard from scratch using a new React-based foundation. We removed low-value legacy features and simplified the architecture to focus on what truly mattered: lifecycle clarity and revenue transparency. This reset allowed us to design a scalable, adaptive system aligned with the author journey and the business model behind it.
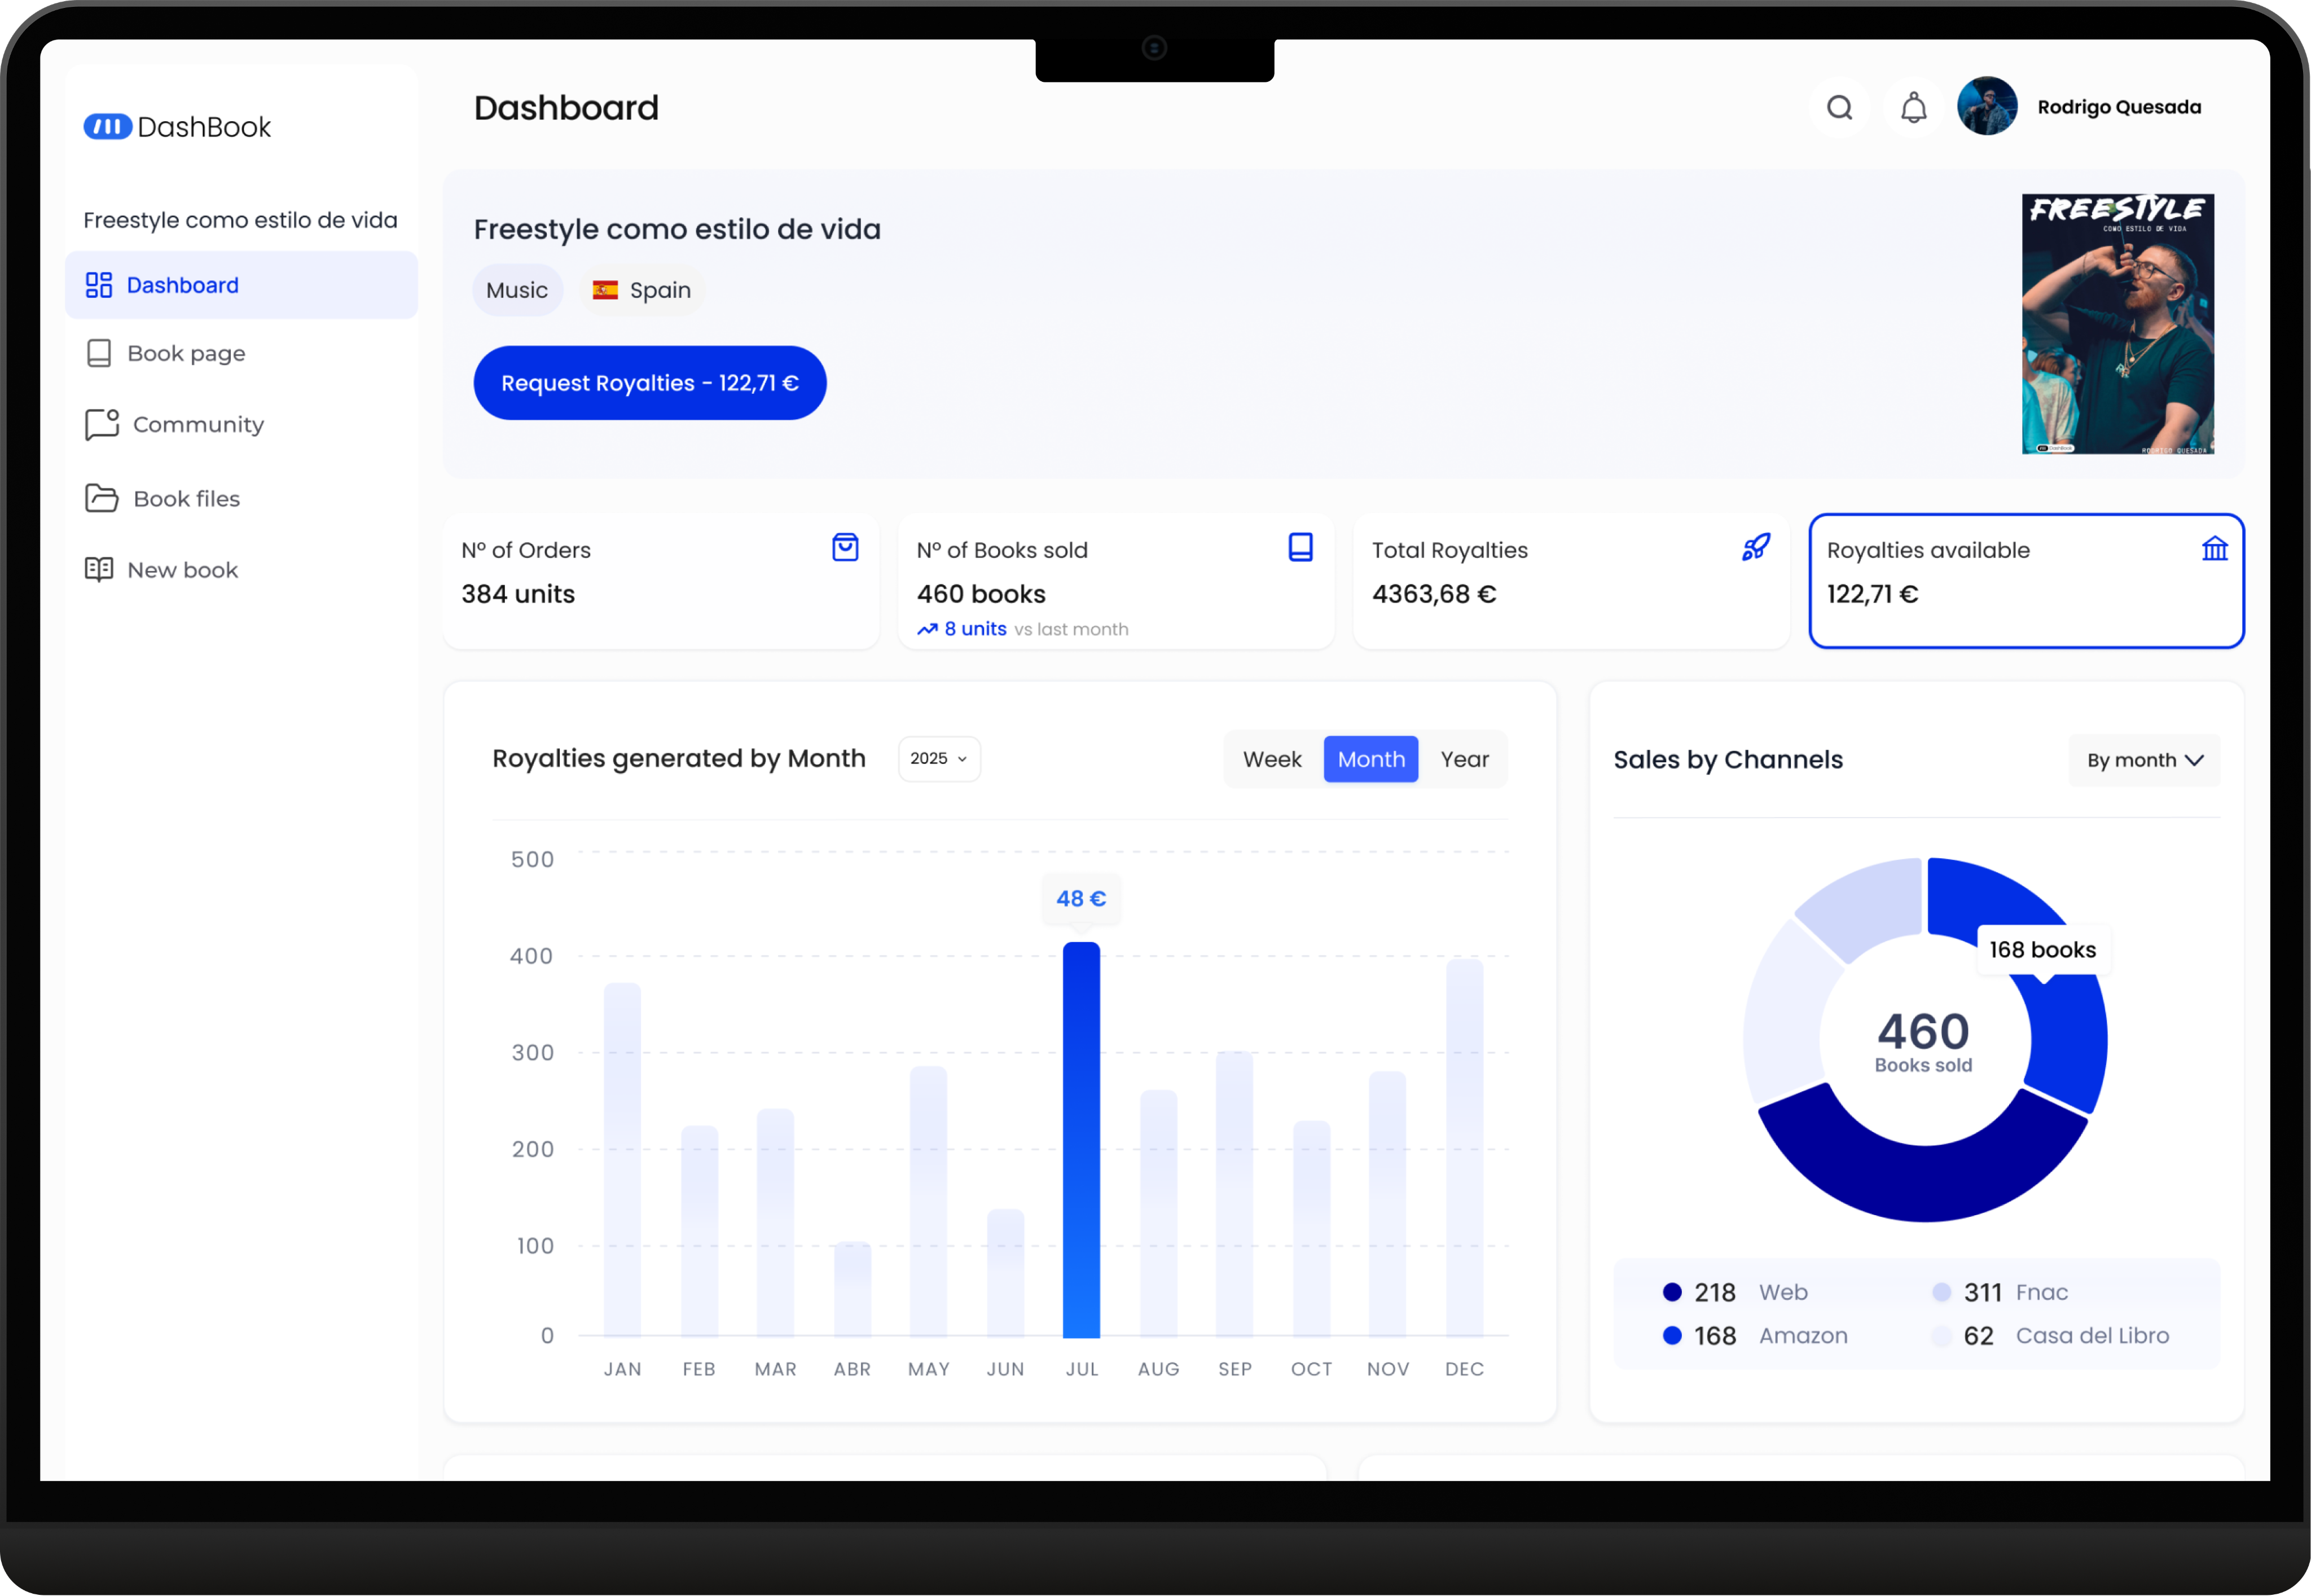
Designing an Adaptive Dashboard
A single static structure could not support authors at different stages of their journey. Pre-sale authors and published authors had fundamentally different priorities. We redesigned the dashboard to adapt based on lifecycle state:
- Pre-sale authors see campaign momentum first: units sold, days remaining, and progress toward the 150-book goal.
- Published authors see financial clarity first: royalties generated, available balance, multi-channel sales, and a visible “Request Royalties” action.
By aligning the information hierarchy with the author’s current goals, the dashboard became context-aware reducing confusion and making the next step obvious.
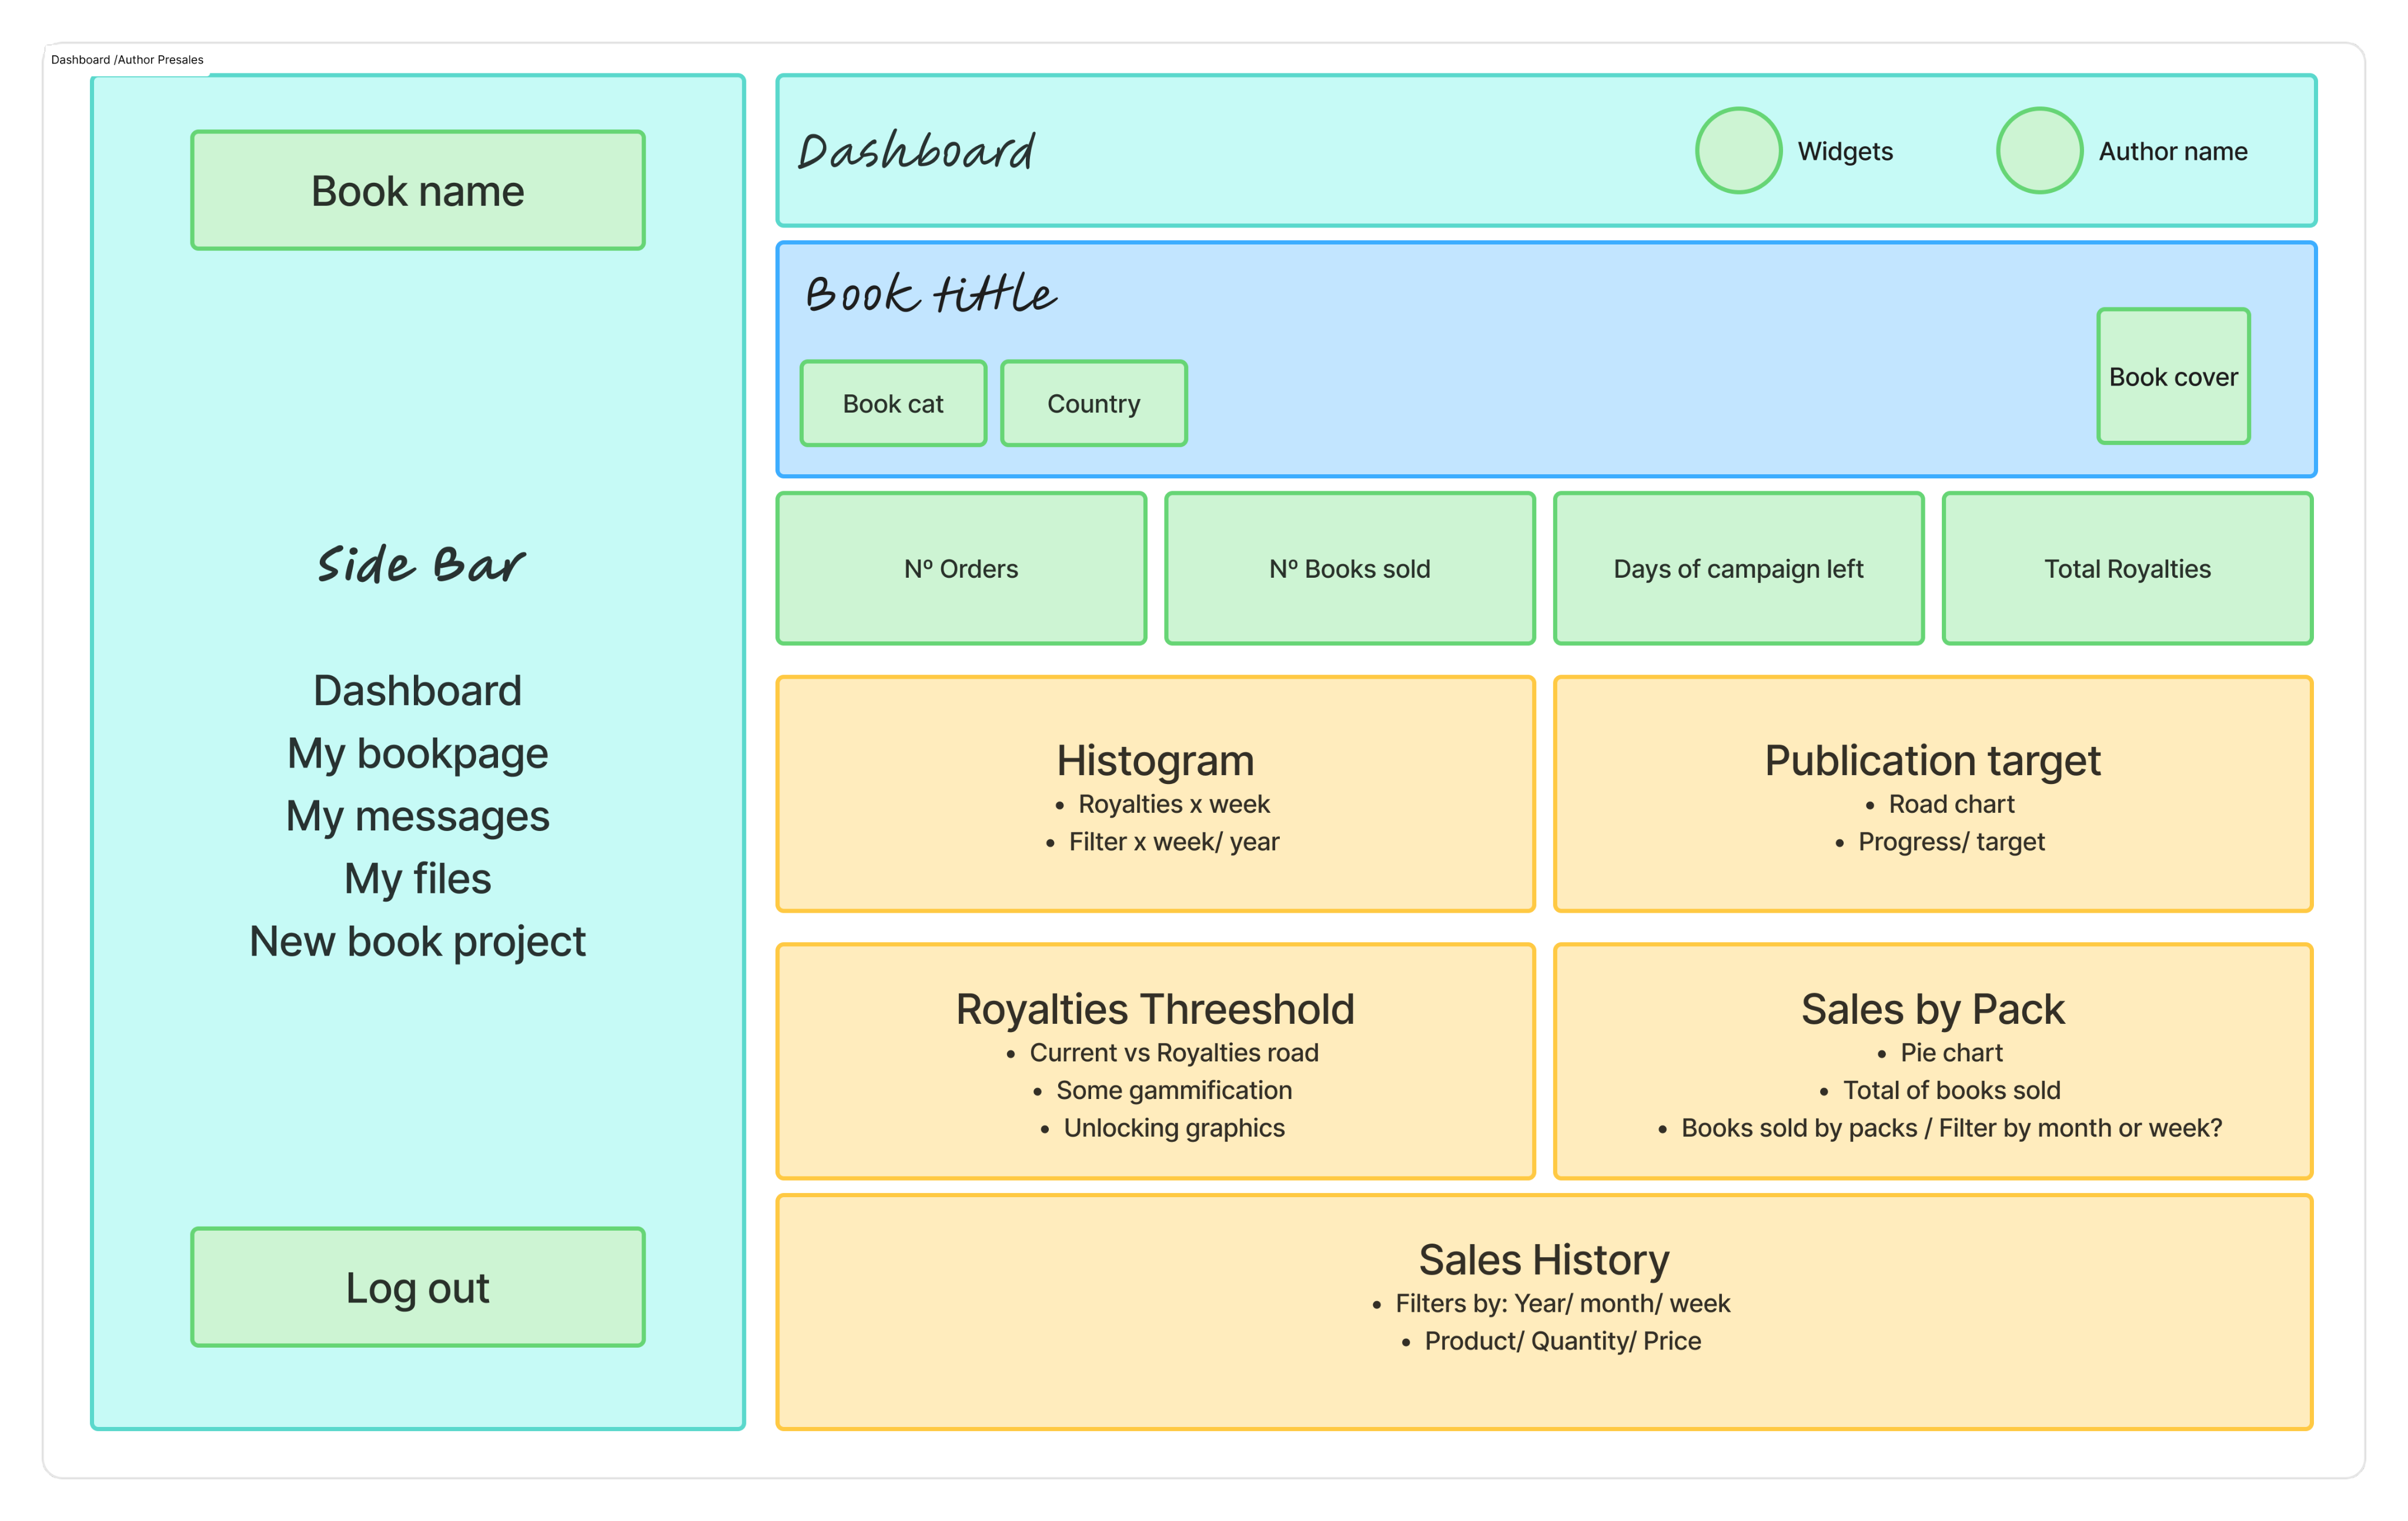
The dashboard structure adapts based on the author lifecycle state
Pre-sales author
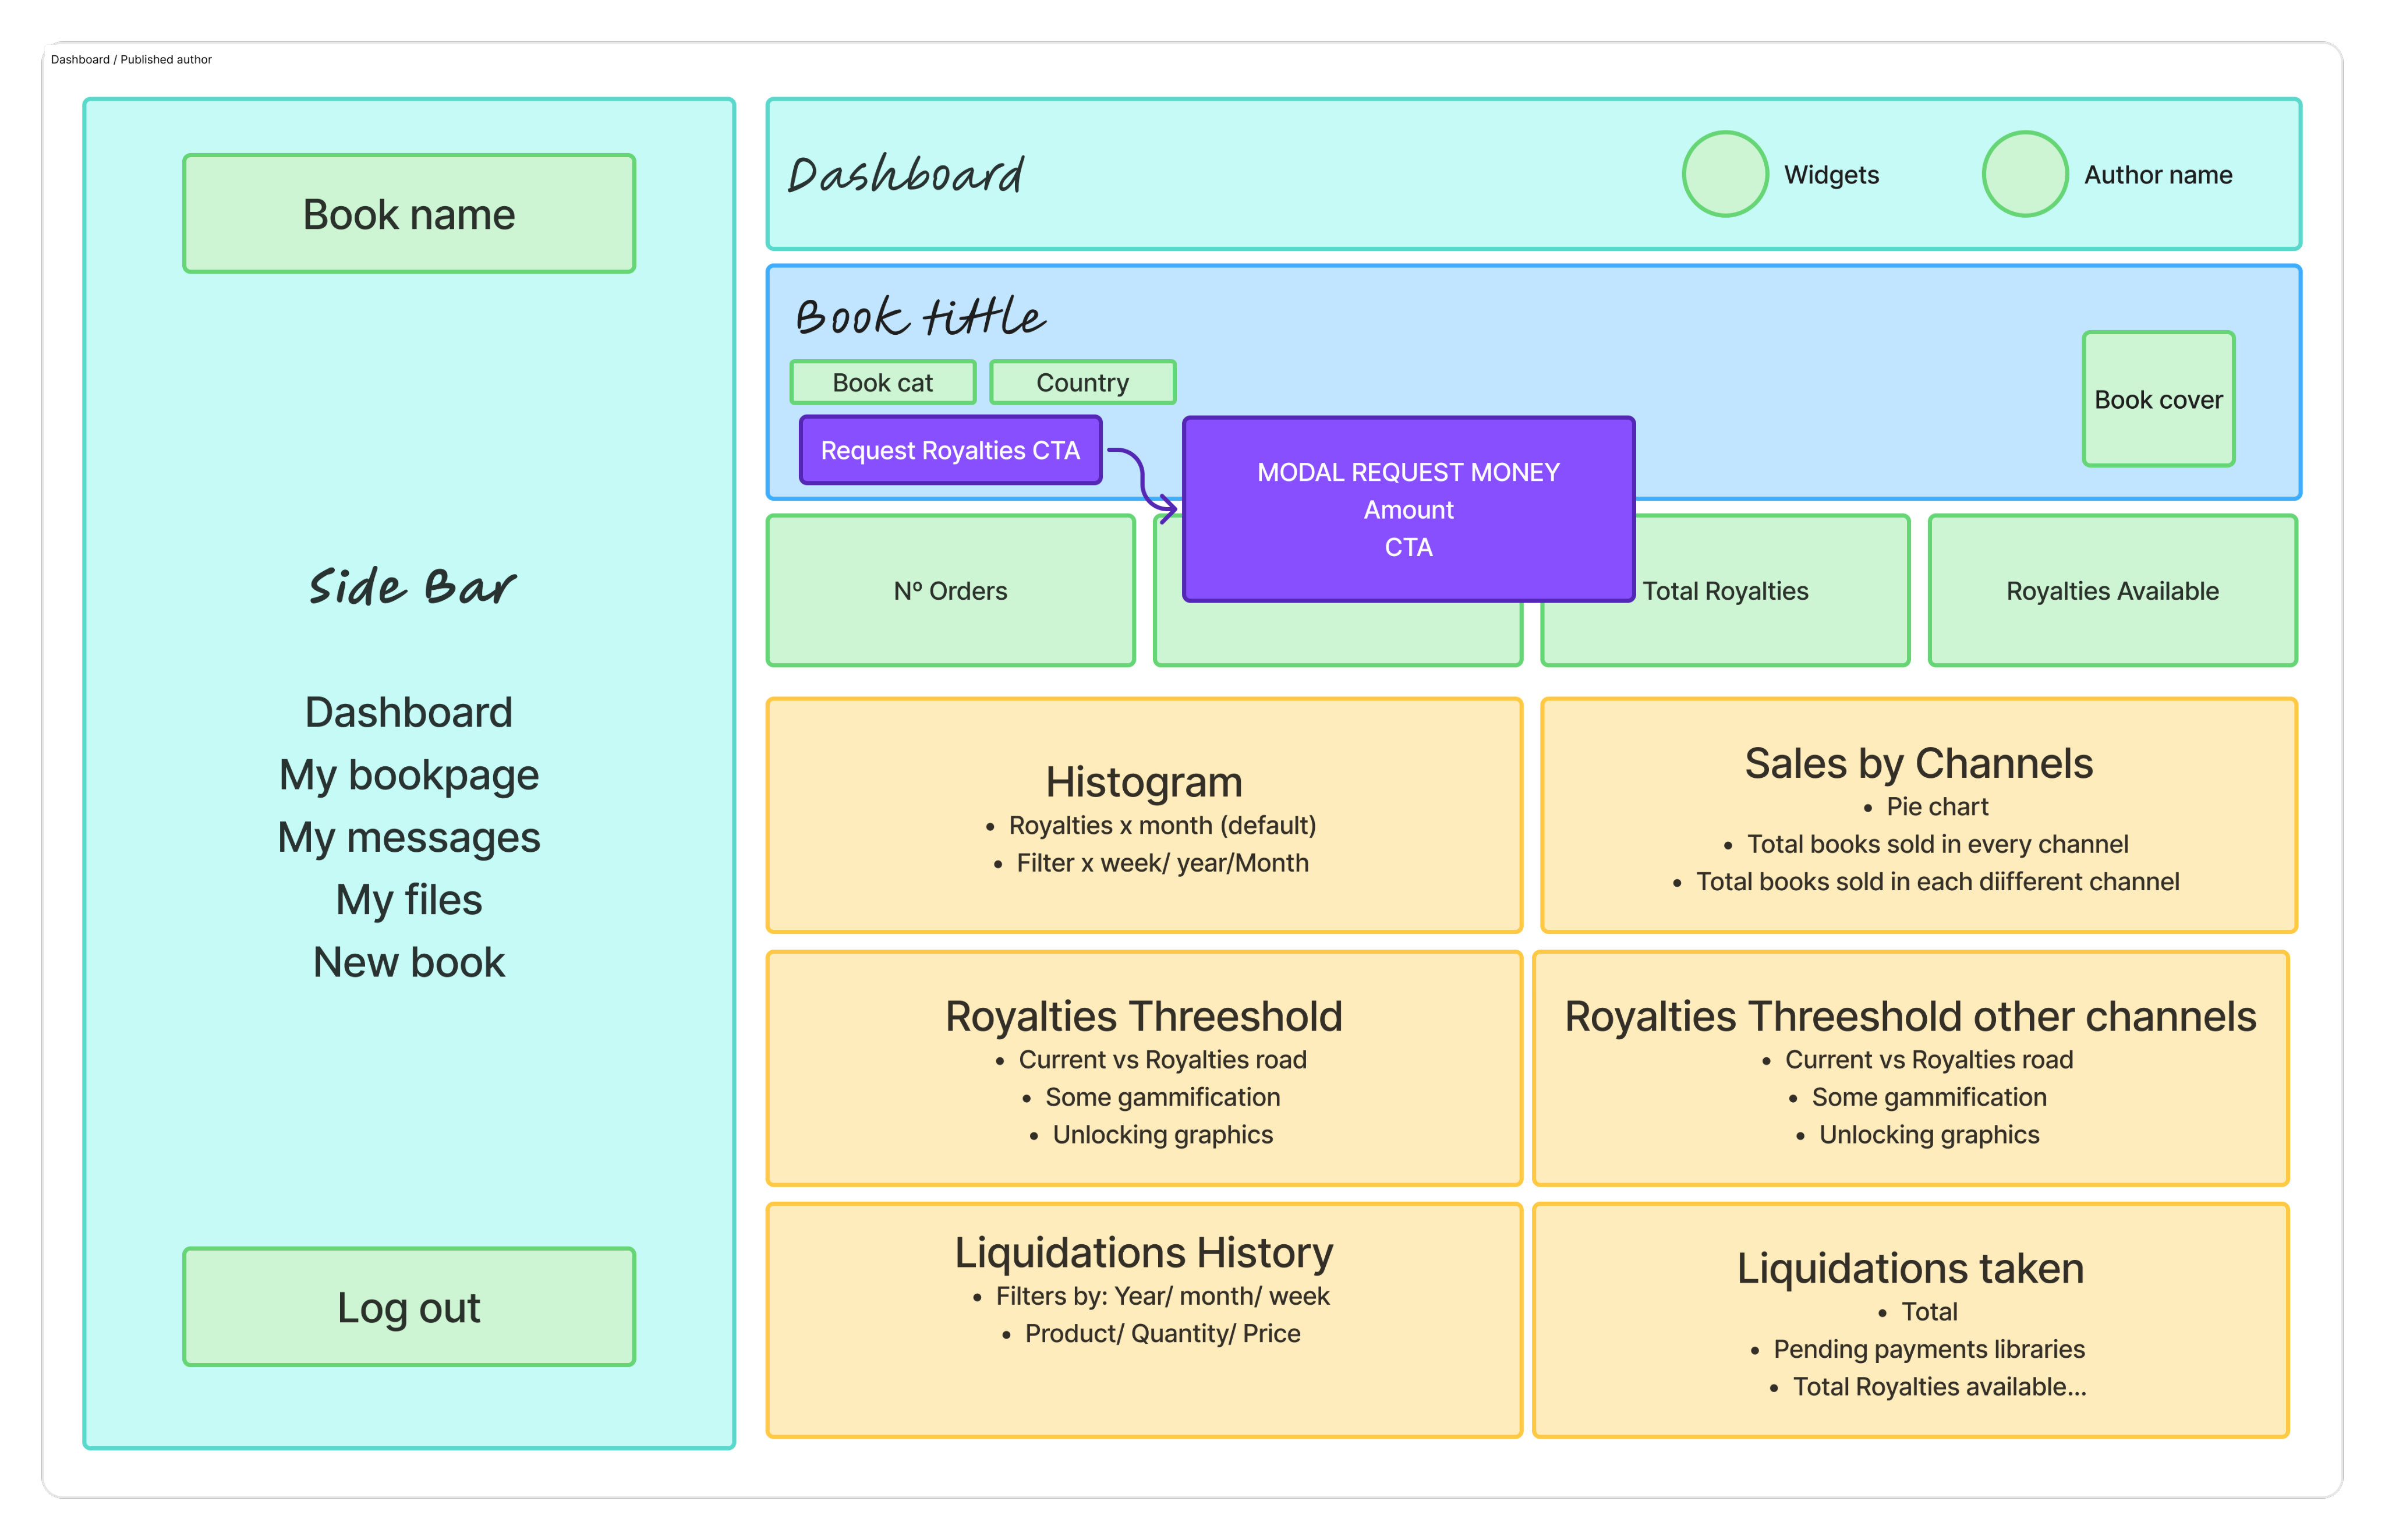
Published author
Making Royalty Logic Understandable
Royalty percentages were contract-based and changed according to sales thresholds. The logic existed — but the dashboard did not explain it clearly. Authors saw numbers without understanding progression, eligibility, or timing. We redefined how royalties were presented by turning financial logic into a clear visual system. This reduced ambiguity and increased confidence in how earnings were calculated.
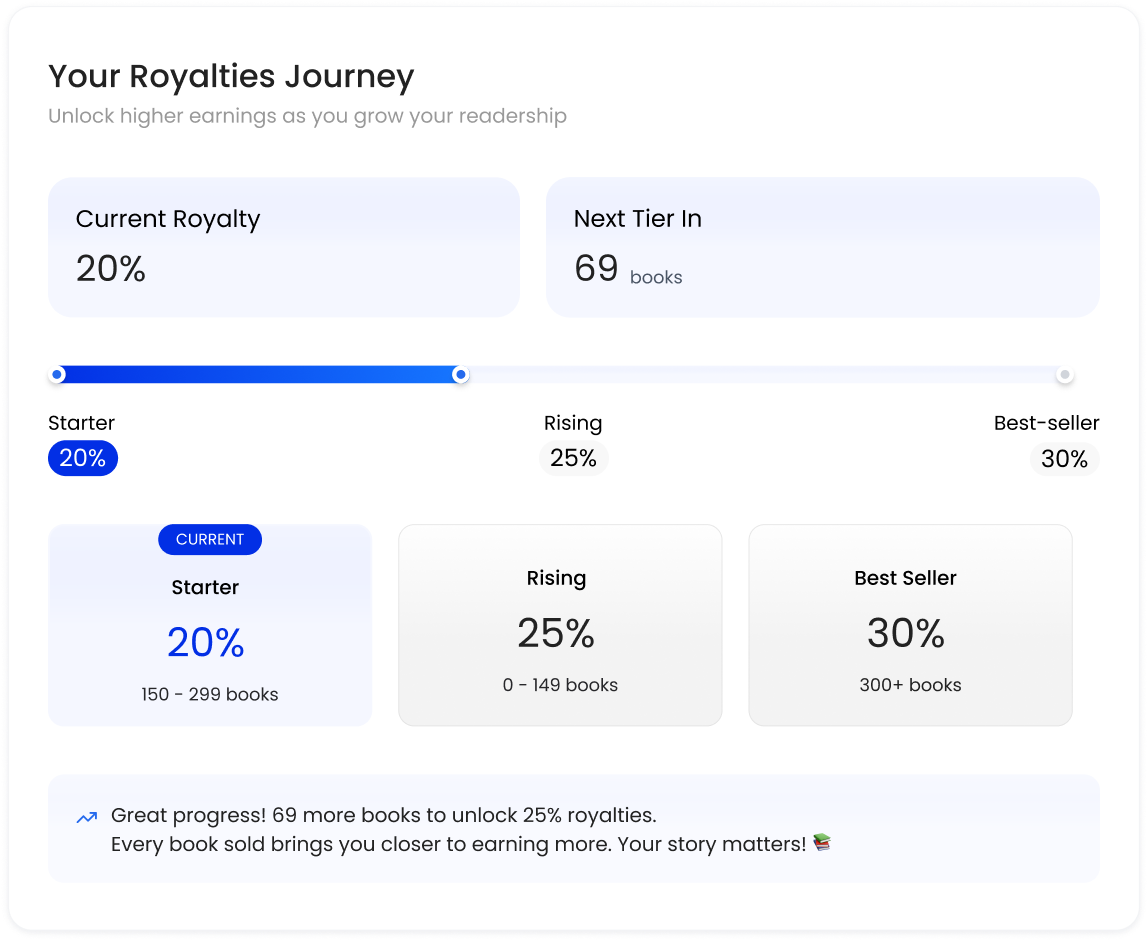
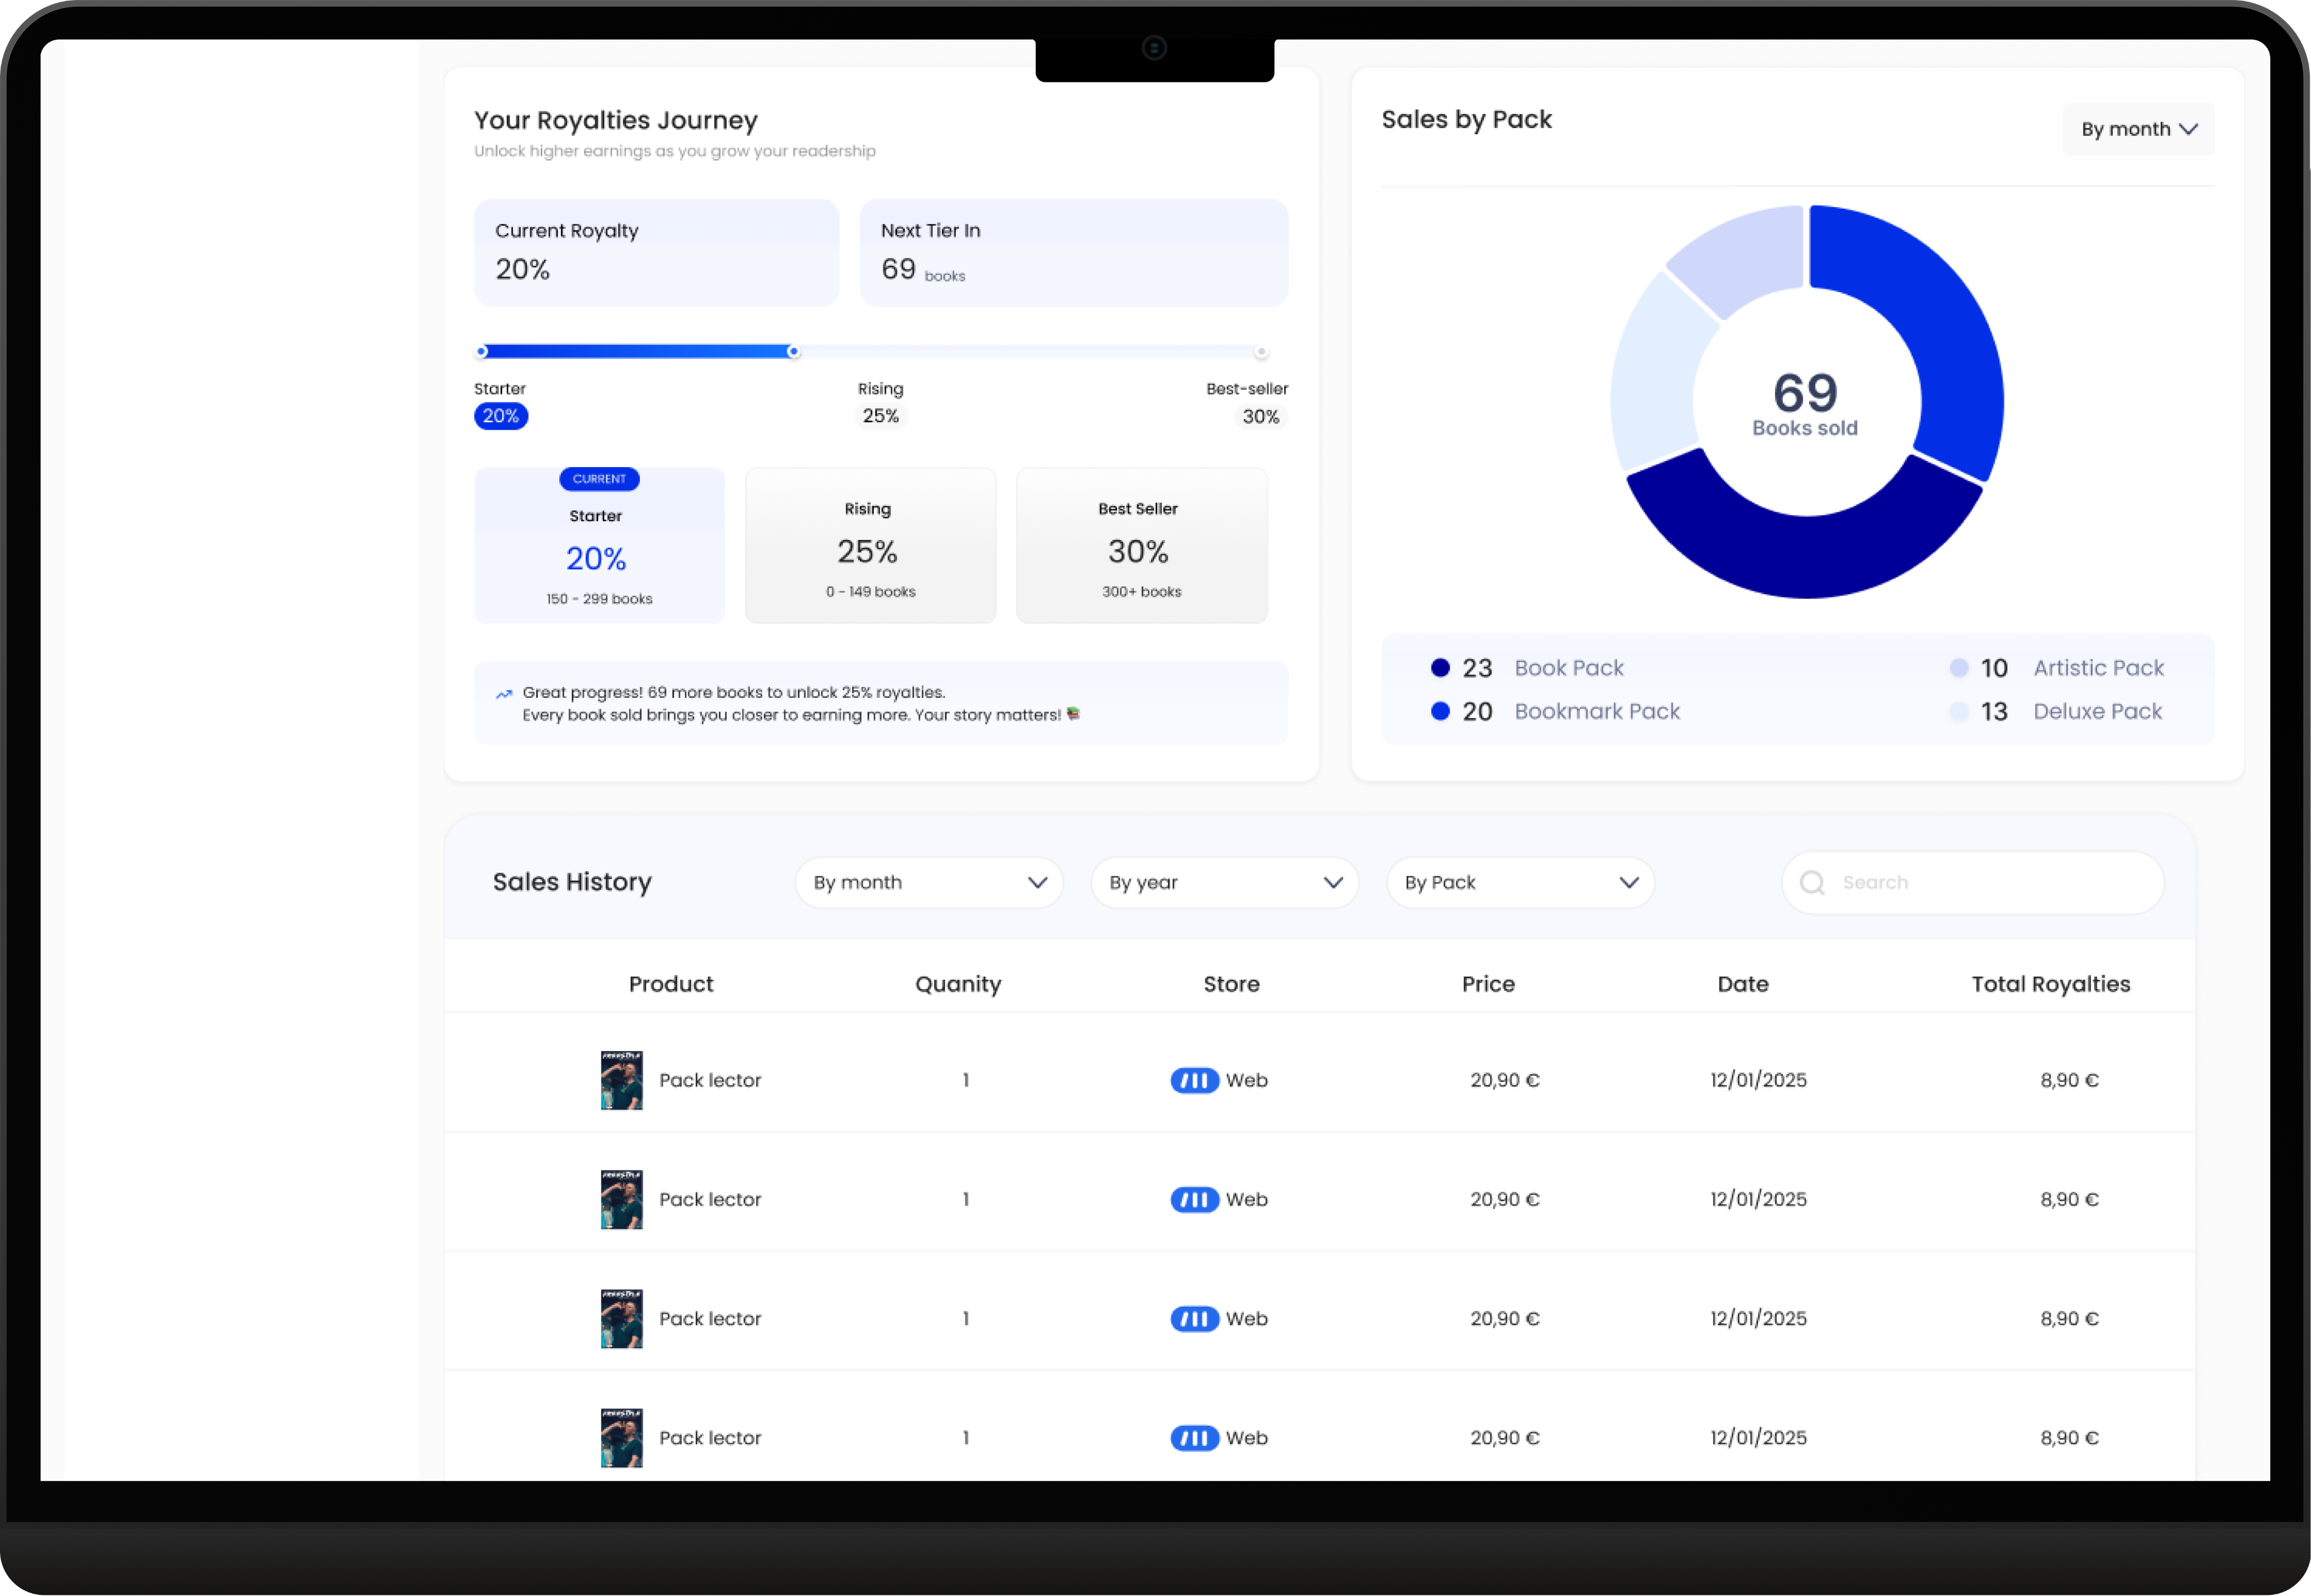
Visualizing Progression Instead of Just Percentages
Instead of showing static percentages, we introduced a royalty journey component that made progression tangible.
- Current tier clearly highlighted
- Next tier explicitly shown
- Number of books needed to unlock the next percentage
- Reinforcing microcopy to reduce uncertainty
Contractual royalty tiers translated into a clear progression system (for Pre-sales authors)
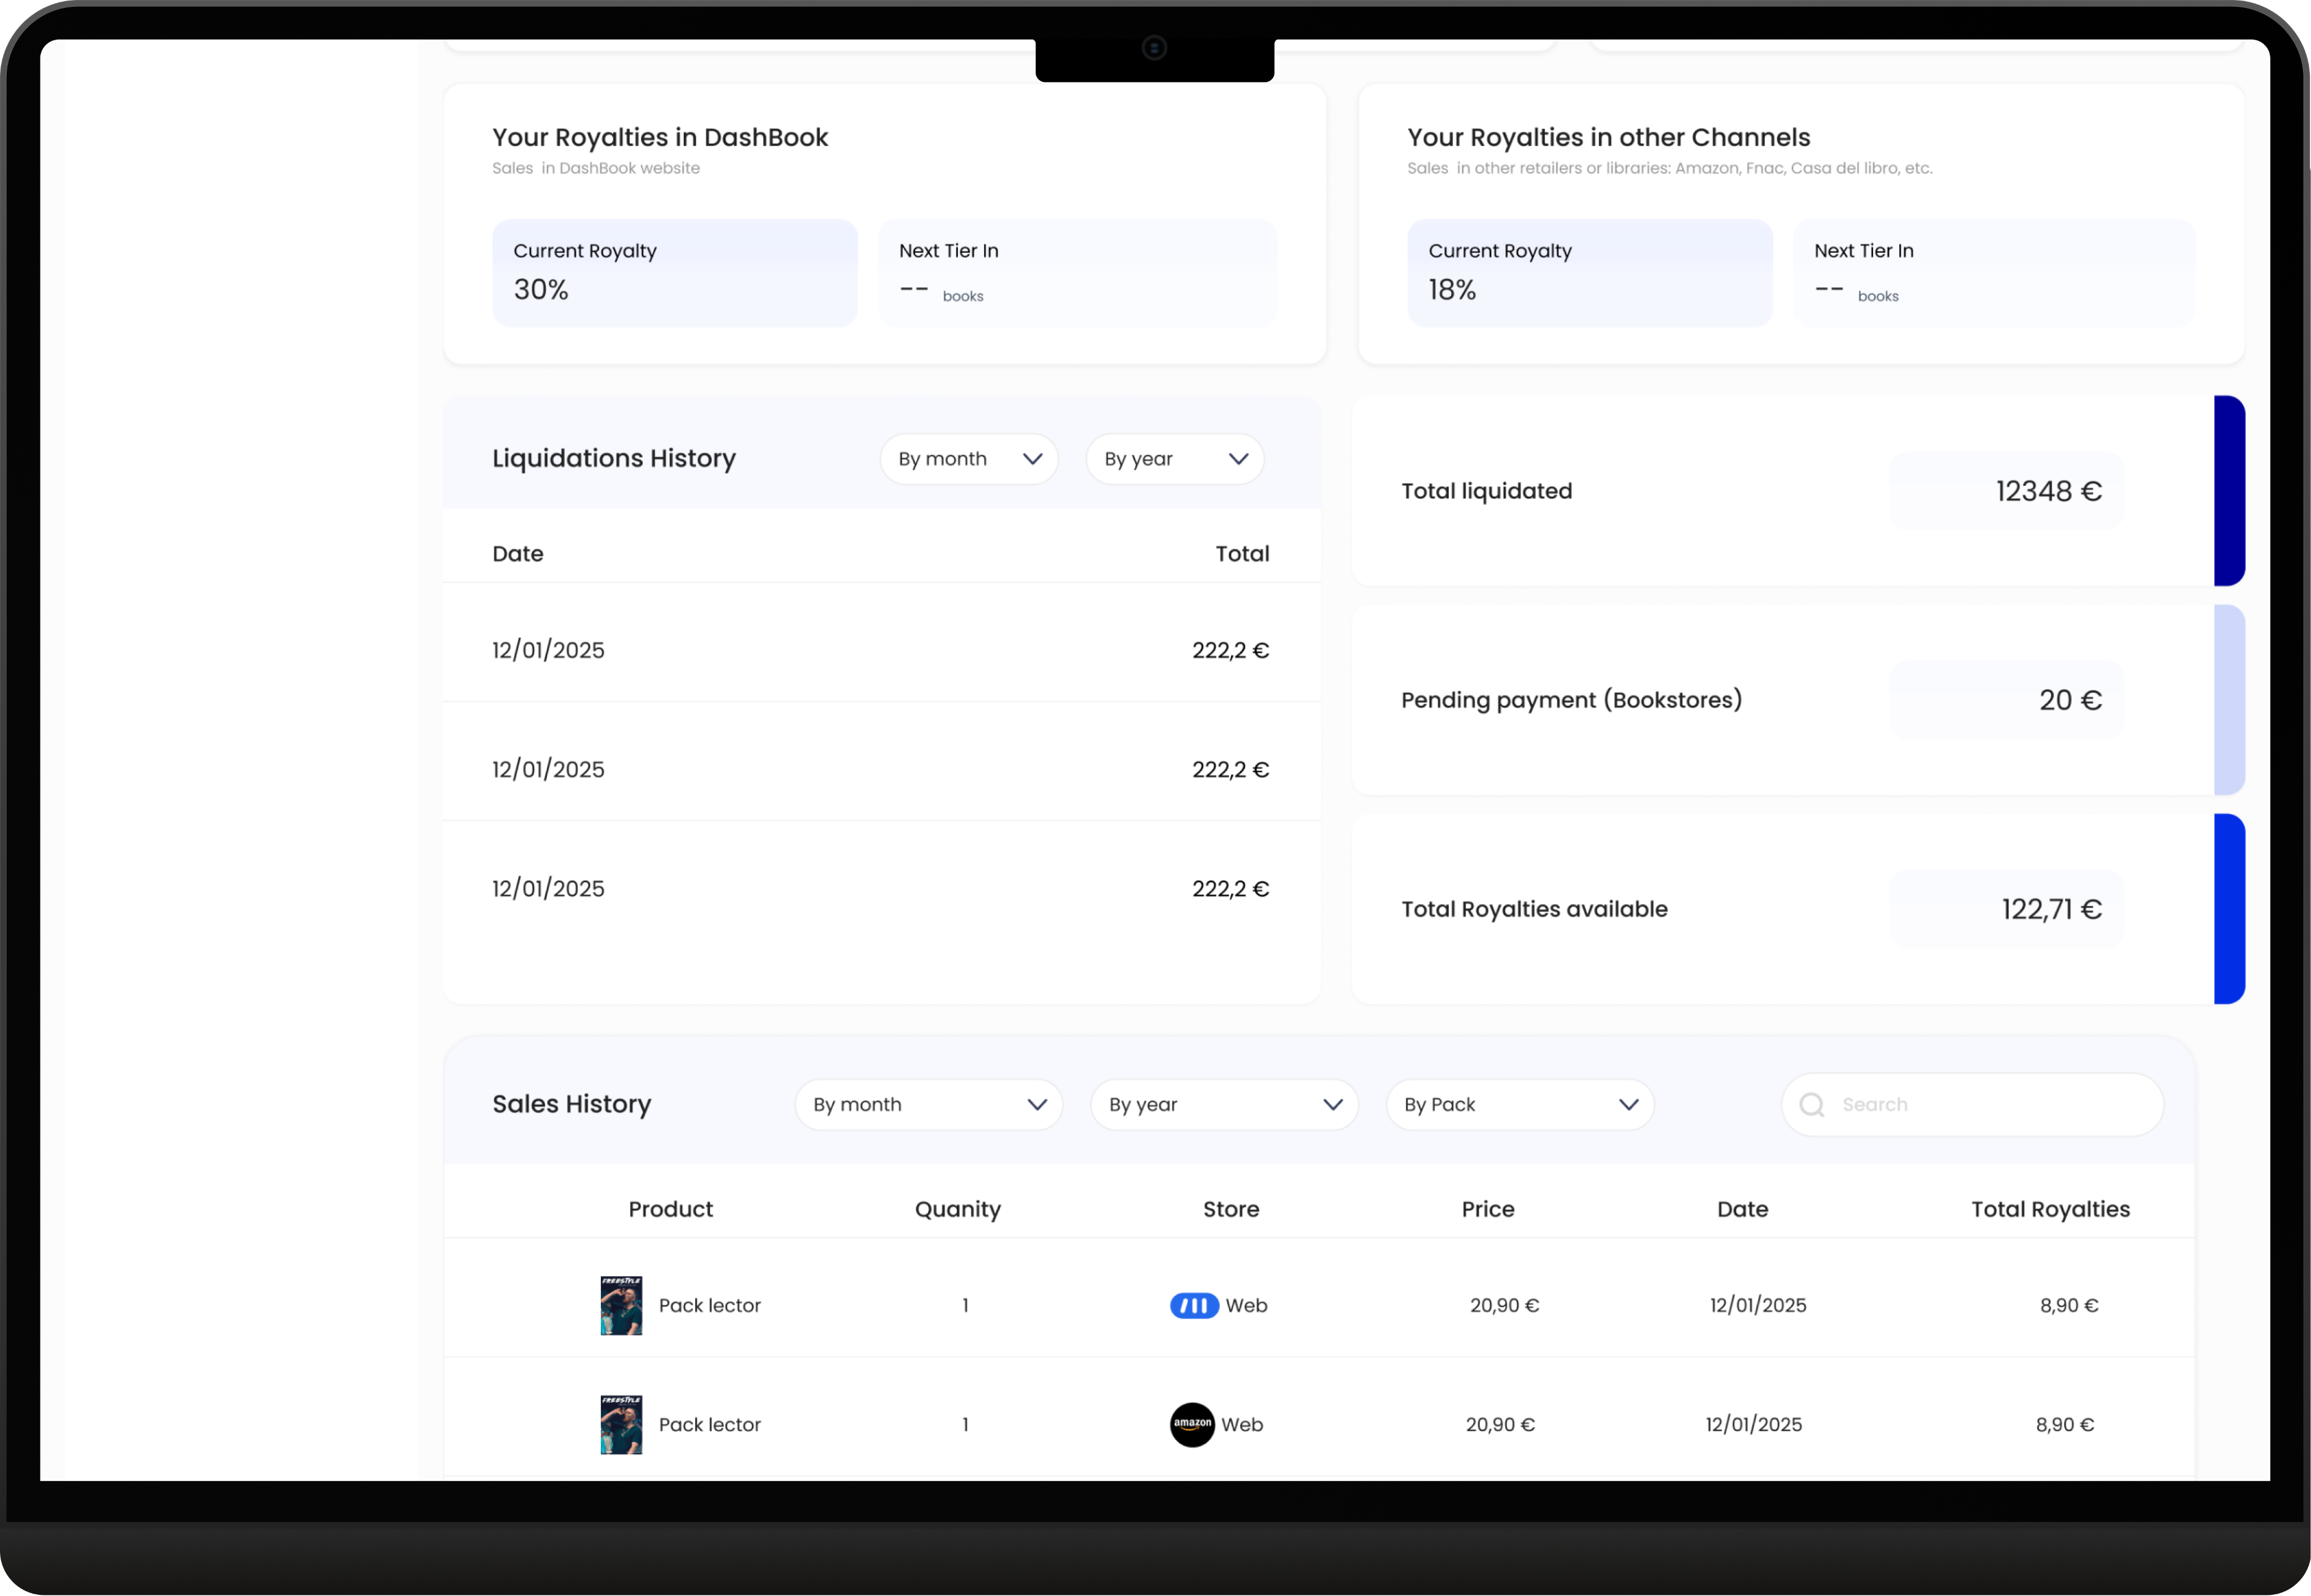
Separating Generated vs Available Earnings
One of the biggest sources of confusion was the difference between total royalties earned and royalties available for withdrawal.
We introduced a clear structural distinction:
- Total Royalties (generated revenue)
- Royalties Available (withdrawable balance)
- Number of books needed to unlock the next percentage
This eliminated ambiguity around timing and payout conditions.
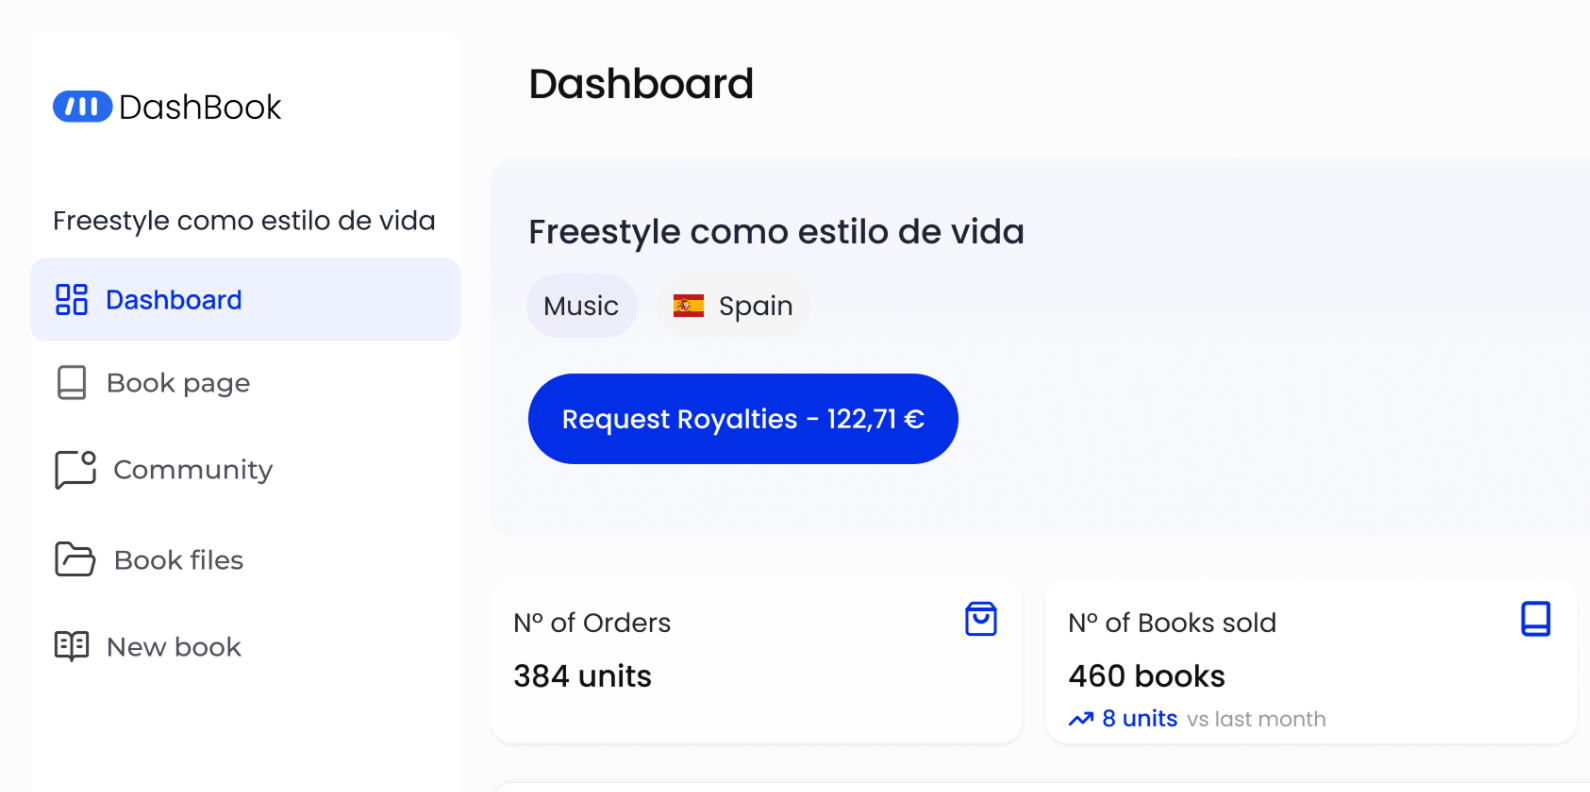
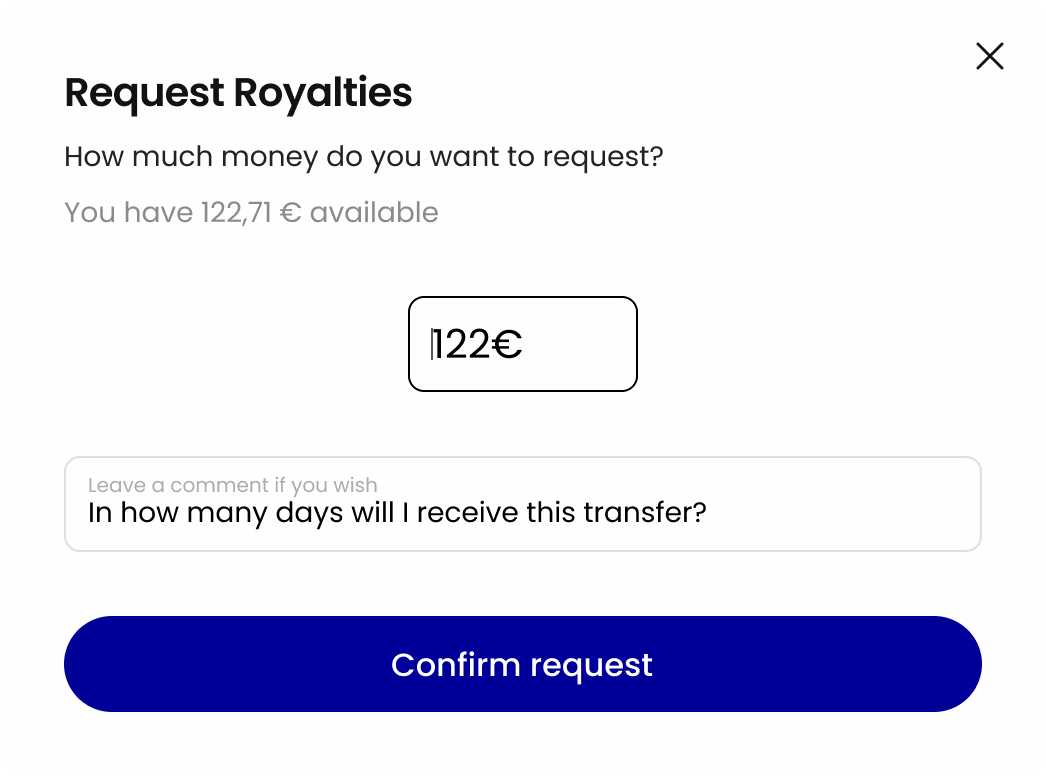
Contextualizing the “Request Royalties” Action
Previously, authors had to ask support how and when to withdraw their royalties. We introduced a contextual CTA:
- Visible only when publish conditions are met.
- Displays withdrawable amount directly
- Triggers a simplified one-click request flow
Action appears only when eligible, reducing friction and support dependency


Making Multi-Channel Revenue Transparent
Books generated revenue across multiple channels (Web, Amazon, Fnac, bookstores). Previously, this logic was fragmented. We consolidated sales data into a clear visual breakdown:
- Channel-level distribution
- Monthly filtering
- Unified royalty accumulation logic
- Reinforcing microcopy to reduce uncertainty
Final Experience Overview
The redesigned dashboard delivers a structured, lifecycle-aware experience that adapts to the author’s stage while maintaining clarity and financial transparency. Pre-sale authors are guided by momentum and progress with campaign goals, days remaining, and sales performance prioritized visually. Published authors transition into a financially actionable view where royalties generated, available balance, multi-channel sales, and payout actions are clearly surfaced. The result is a dashboard that feels stable, trustworthy, and aligned with how authors actually experience their publishing journey.
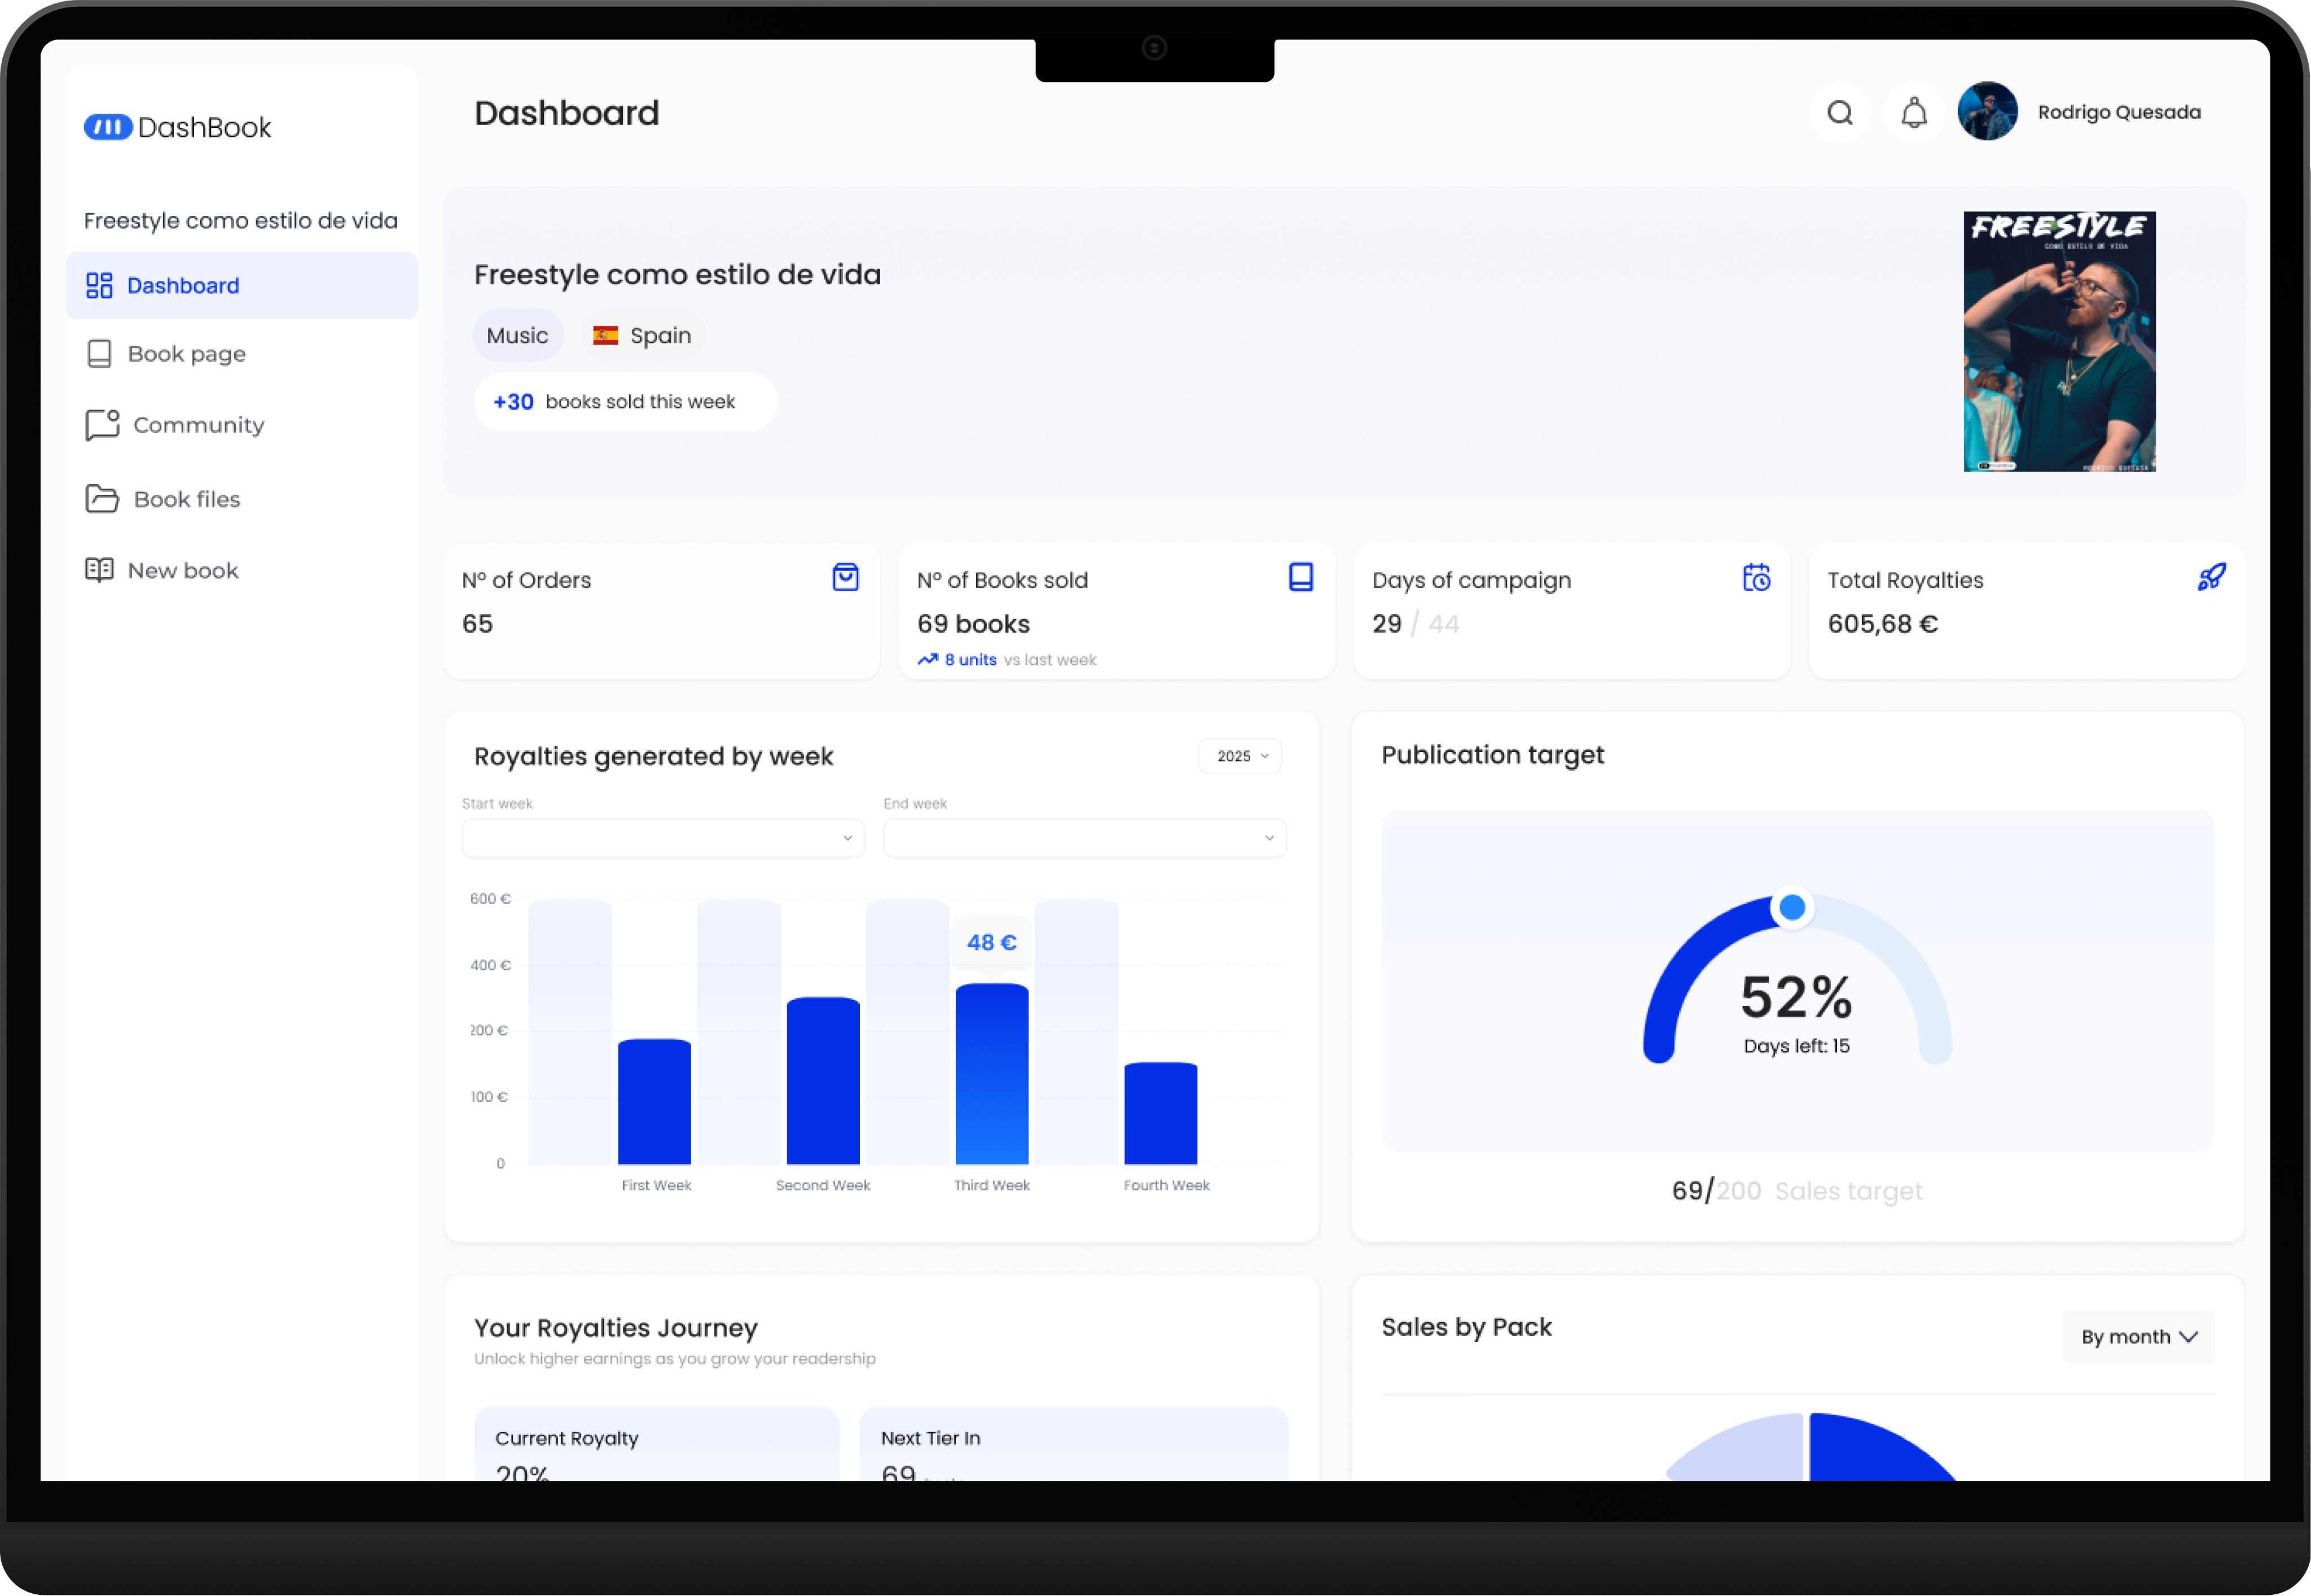
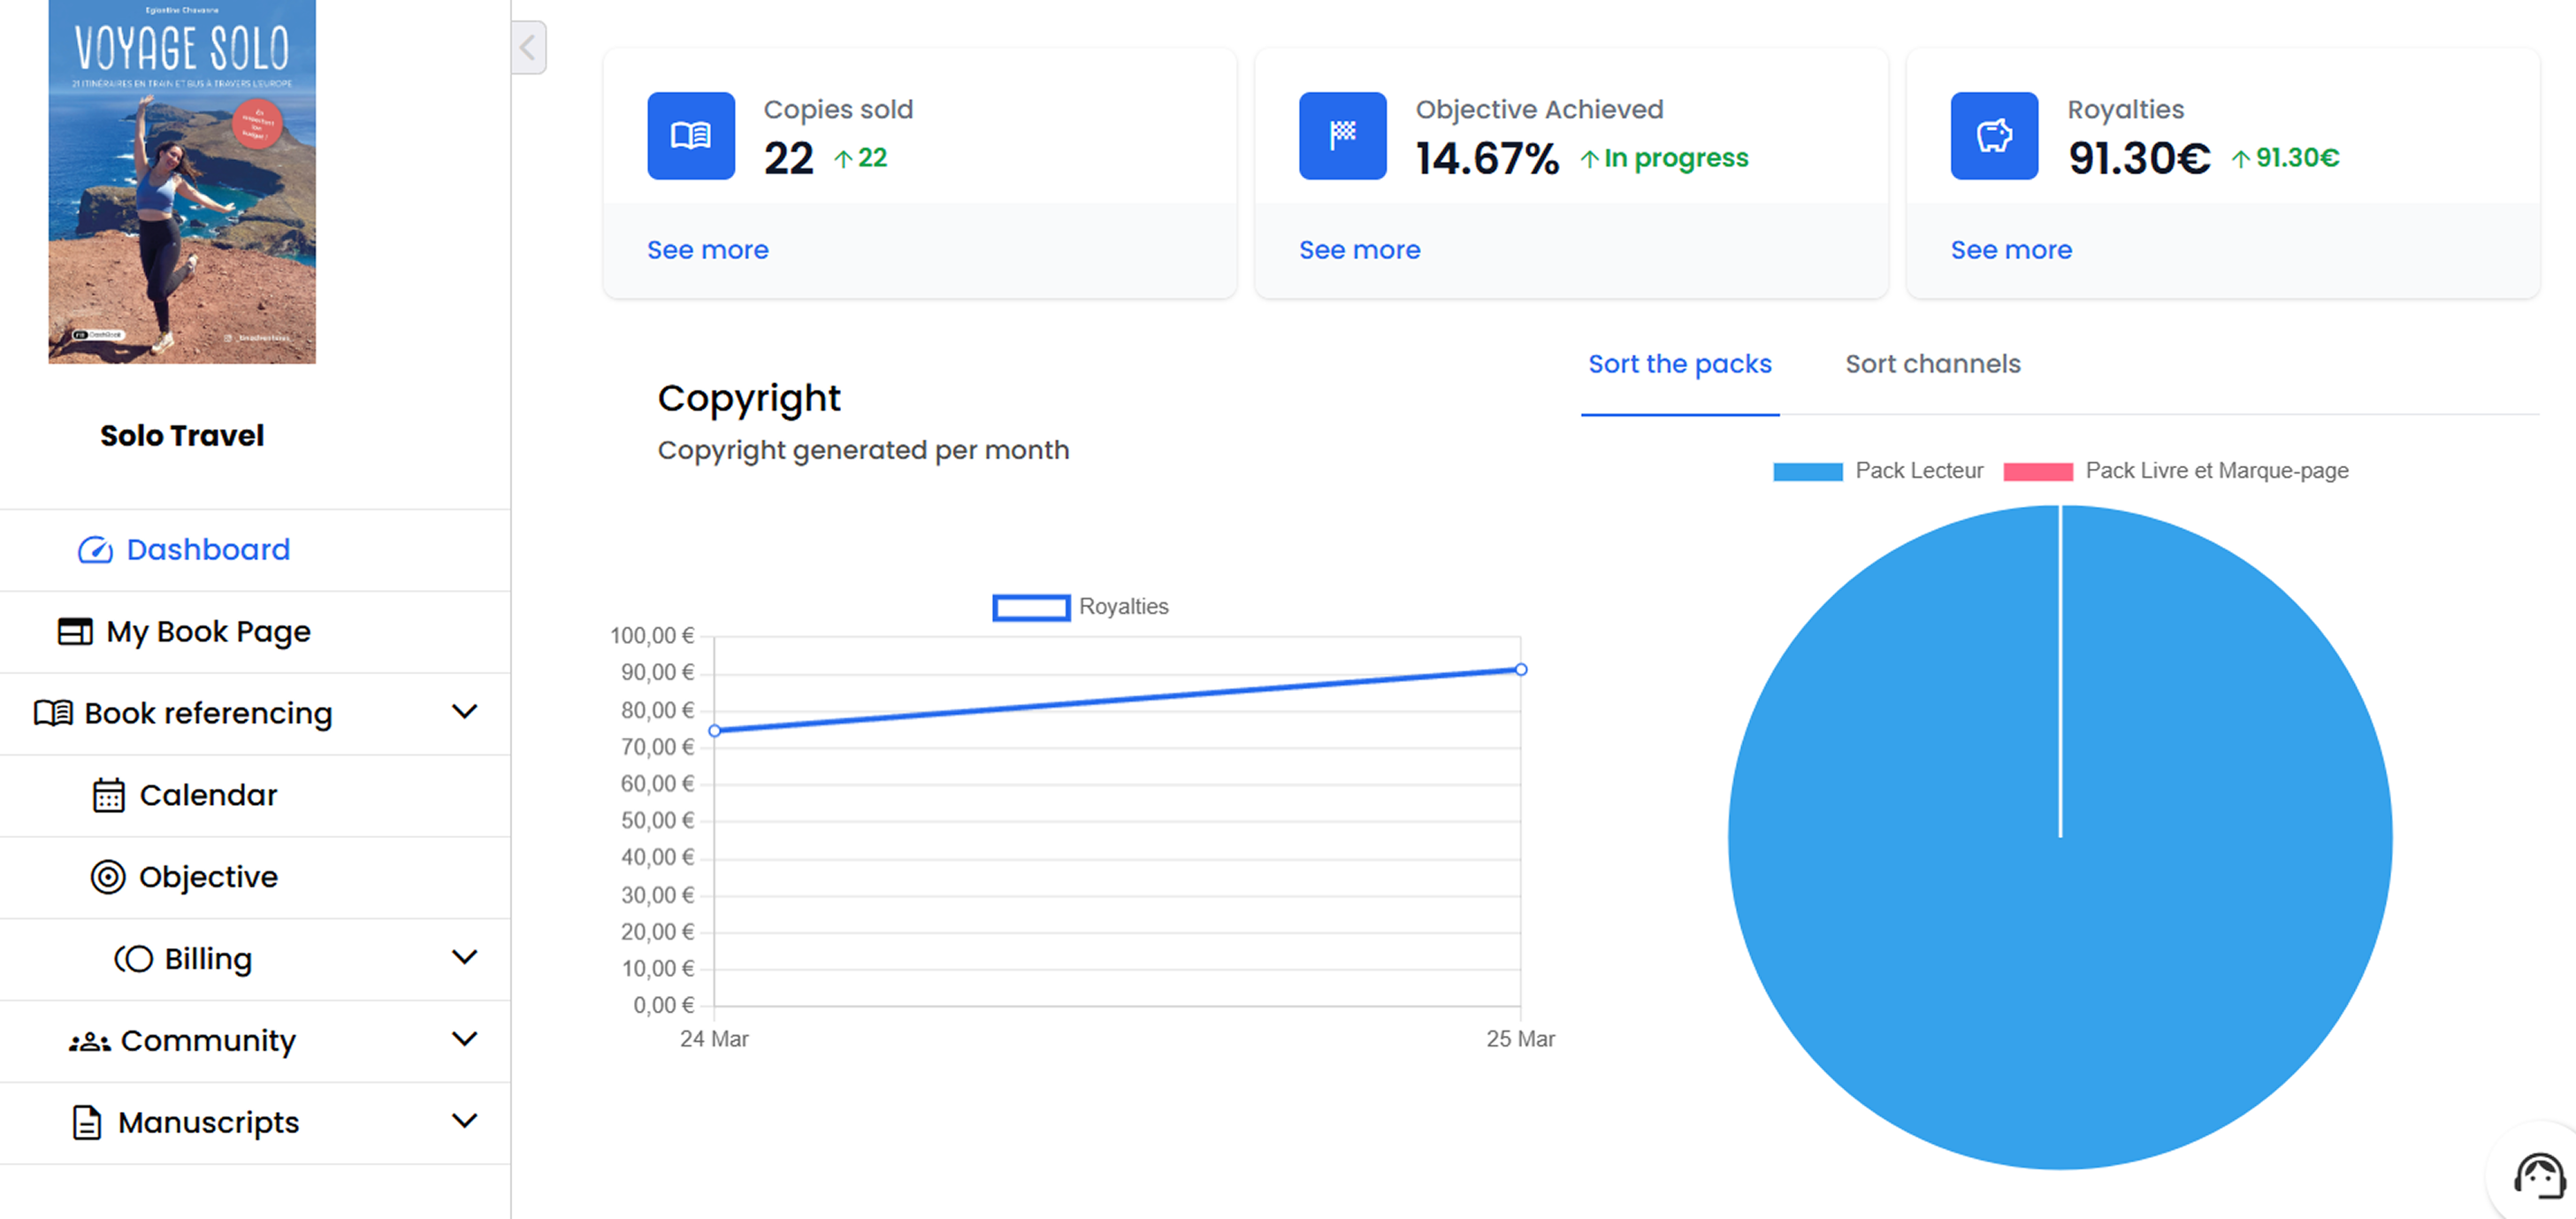
Pre-sales Dashboard focuses on:
- Clear progress toward the 150-book publication goal.
- Time pressure visibility (days remaining).
- Weekly performance tracking to reinforce momentum.
- Royalty tier progression as motivational feedback.
- Sales breakdown to guide promotional decisions.
Pre-sale view prioritizing campaign momentum and publication goal
The dashboard adapts automatically based on the author's lifecycle stage, reshaping priorities from growth to financial management.
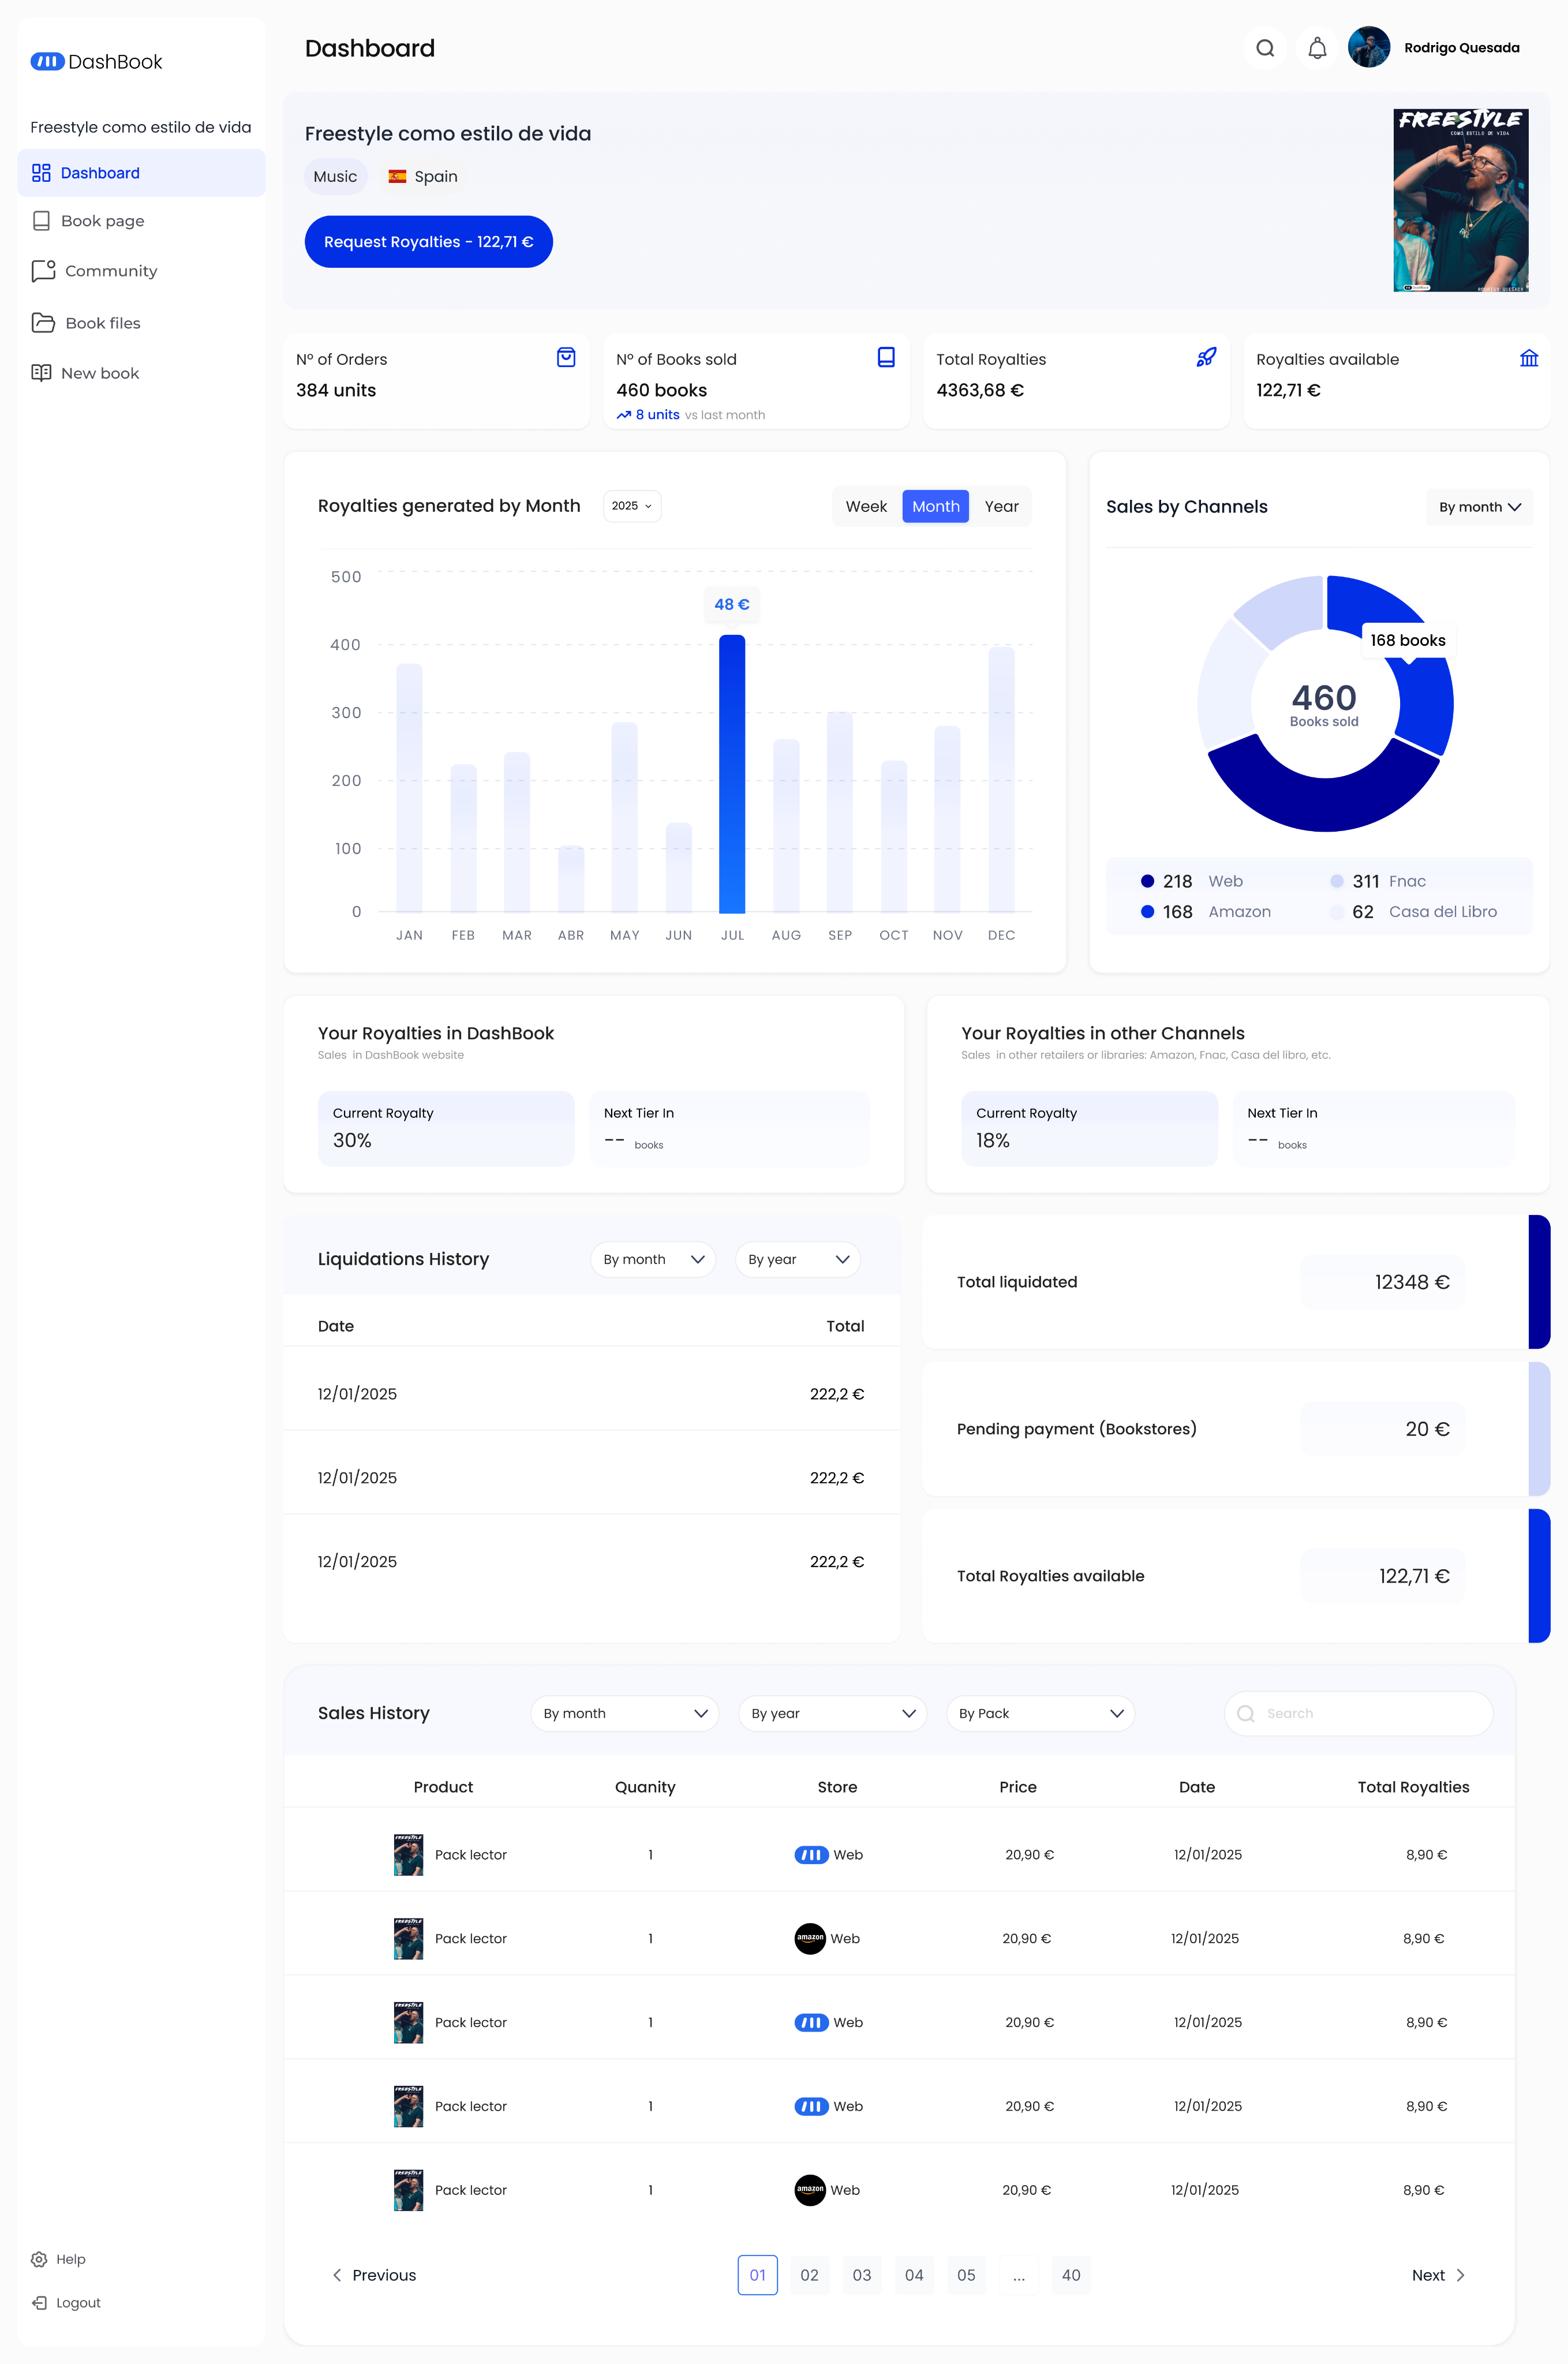
Published Dashboard focuses on:
- Immediate visibility of withdrawable royalties.
- Explicit separation of earned vs available balance.
- Multi-channel sales transparency (Web, Amazon, Fnac, bookstores).
- Historical tracking of liquidations and pending payments.
- Motivational tier system aligned with contractual royalty thresholds.
- Strategic CTA placement for royalty withdrawal.
Published view shifting focus toward royalties, multi-channel sales, and payout actions

Impact
The redesign did not only improve usability — it reduced operational friction and strengthened financial transparency across the platform.
Operational Impact
- Support tickets related to royalties and dashboard confusion decreased from ~50 to ~15 per month.
- Reduced dependency on account managers for royalty withdrawal clarification.
- Fewer manual explanations of contractual royalty thresholds
- Increased author autonomy in managing earnings
Financial & Product Impact
- Clear distinction between generated and available royalties reduced payout misunderstandings.
- Contextual “Request Royalties” action made withdrawal eligibility explicit, reducing reliance on support for payout clarification.
- Improved trust in multi-channel revenue tracking.
- Scalable dashboard architecture supporting platform growth across France, Spain, and LATAM.
Structural Impact
- Transition from legacy structure to a lifecycle-based adaptive system.
- Alignment between product logic and contractual revenue model.
- Foundation prepared for future feature expansion without structural rework.
Learnings
Redesigning the Author Dashboard reinforced the importance of aligning product structure with business logic and user lifecycle. A system may function technically, but if it does not reflect how users’ priorities evolve, friction and confusion emerge. Designing for lifecycle adaptation required stepping back from individual screens and thinking in terms of states, progression, and financial clarity.
Working within contractual royalty constraints also strengthened my ability to translate complex revenue logic into understandable, actionable interfaces. Transparency is not about exposing more data — it’s about structuring it in a way that builds confidence.
Finally, this project highlighted the impact of structural decisions. Choosing to rebuild rather than iterate allowed us to create a scalable foundation that reduced operational friction and better supported platform growth.
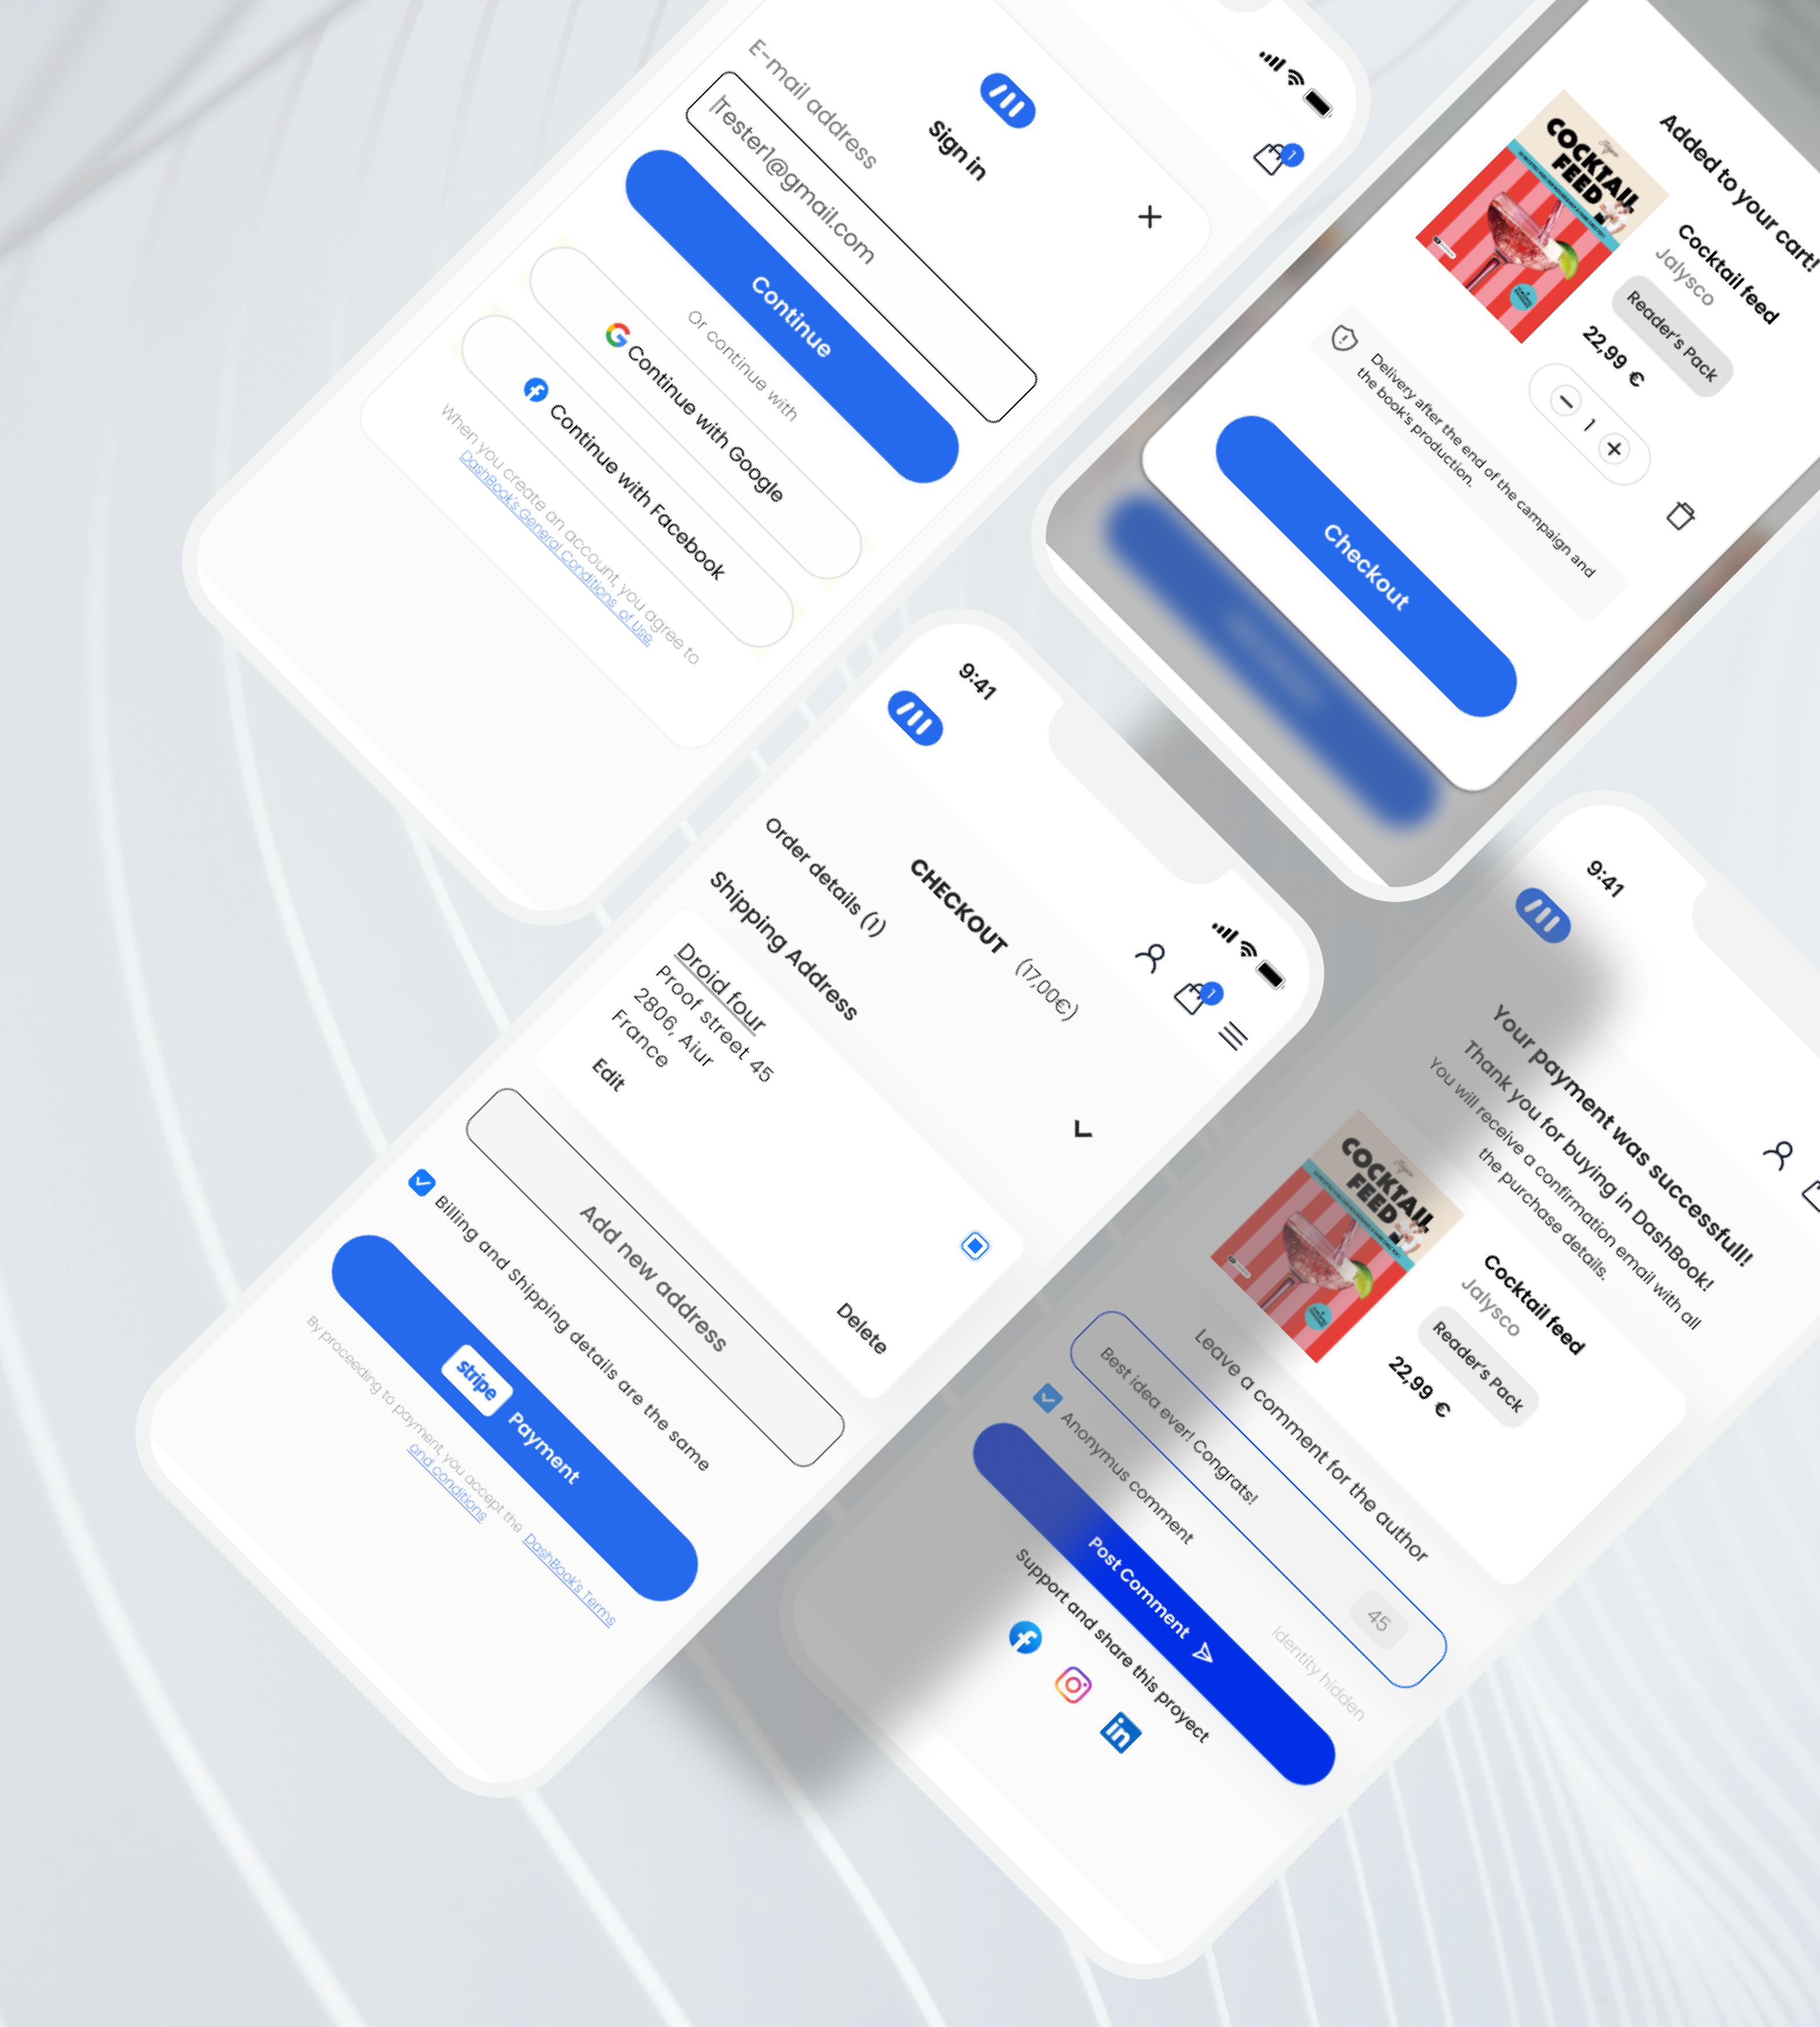
From complex Dashboards to Checkout flows, see the breadth of my Design Projects.
More projects
Product Design | In-house software | AI Prototyping
Internal Tool for Content Operations
View case study


UX/UI Design | Product Design
Building a Scalable B2B Dashboard for a Creator Publishing Platform
Designing a lifecycle-based dashboard for campaign performance and royalties, reducing confusion and operational friction for revenue partners.
↓ support tickets by 70%, lowering operational support load (50 → 15 per month)
Royalties system
Project overview
Product: Author Dashboard (Performance & Royalties)Company stage: Scale-upRole: UX/UI Designer — Lead DesignerPlatform: Web (Desktop-first usage)Status: Launched and iteratively improved
The project involved a full structural redesign of DashBook’s author dashboard — transforming a backend-driven interface into a scalable, lifecycle-based system focused on performance visibility, revenue clarity, and operational efficiency.
Product Context
DashBook was scaling from an early-stage startup into a multi-market publishing platform, managing 50+ active pre-sale campaigns and supporting over 200 published authors across France, Spain, and LATAM. Authors were not just users — they were revenue partners. The business depended on their ability to run successful campaigns, reach a 150-book publication threshold, and continue generating royalties across multiple sales channels once published.
The dashboard was the operational core of this journey. During pre-sales, authors tracked momentum toward publication. After launch, they relied on it to monitor sales performance, royalties, and payouts. As the platform grew, it became clear that a single static dashboard structure could no longer support two fundamentally different lifecycle stages.
Problem
The Dashboard Didn’t Reflect the Author Lifecycle
As the company scaled across France, Spain, and LATAM, the system remained structurally unchanged treating all authors the same, regardless of their lifecycle stage. However, these were fundamentally different product states:
- During pre-sales, authors were focused on reaching 150 books sold within 44 days. They seek for visibility, momentum, and clarity around their publication target.
- Once published, they shifted to monitoring royalties, sales channels, and withdrawal timing.
The interface did not adapt to these changing needs. As a result:
- Performance metrics and financial data were mixed without hierarchy.
- Royalties were visible but not clearly actionable.
- The contractual royalty thresholds were technically present but conceptually unclear.
- Required manual processes for royalties withdrawal.
- Authors frequently contacted support to understand when and how they could withdraw earnings.
The system was functional — but not strategically designed around the author journey.
A single static structure attempted to serve multiple author states without differentiation
My Role
I led the complete redesign and re-implementation of DashBook’s Author Dashboard, replacing the legacy system with a new React-based product foundation. This was not an incremental update — we intentionally removed low-value legacy features (such as Calendar and Manuscripts) to rebuild the system around clarity, scalability, and financial logic. Working closely with the PM and engineering team, we made the strategic decision to start from scratch. I redefined the information architecture, separated performance tracking from financial management, and introduced a clear lifecycle structure for pre-sale and published authors.
Research & Insights
Insights emerged from recurring author conversations and direct collaboration with Customer Support, Business Developers, and Editors teams in continuous contact with authors at every stage of their journey.
By analyzing support tickets and operational patterns, we identified repeated confusion around royalties, sales tracking, and payout procedures particularly once books transitioned from pre-sale to publication.
I found out something critical: The dashboard did not evolve with the author publishing cycle.
Key Observations
Author priorities shift depending on lifecycle stage
- Pre-sale authors focused on momentum and campaign progress.
- Published authors focused on financial clarity and payout control.
Static dashboards fail in dynamic business models
A single structure could not support campaign tracking, revenue thresholds, multi-channel royalties, and payout management simultaneously.
Royalty threshold system was contractually defined but visually abstract
Authors didn’t understand:
- Where they currently stood
- What was needed to reach the next tier
Manual royalty processes increased uncertainty
Authors often contacted internal teams to understand when and how to withdraw royalties, indicating a lack of actionable clarity within the product itself.
Core Insight
The issue was not missing data. It was the absence of a lifecycle-aware structure and revenue clarity.
The dashboard needed to:
- Adapt to the author’s state
- Clarify financial progression
- Reduce dependency on human support
- Increase trust in revenue transparency
Legacy dashboard treating all authors equally, regardless of lifecycle stage, and mixing performance and financial data without contextual prioritization.
Design Strategy
Rethinking the Dashboard from the Ground Up
The legacy dashboard had grown around technical decisions rather than author needs, resulting in a fragmented structure that mixed performance, royalties, and secondary features without clear priorities. Instead of iterating on top of those constraints, we rebuilt the dashboard from scratch using a new React-based foundation. We removed low-value legacy features and simplified the architecture to focus on what truly mattered: lifecycle clarity and revenue transparency. This reset allowed us to design a scalable, adaptive system aligned with the author journey and the business model behind it.
Designing an Adaptive Dashboard
A single static structure could not support authors at different stages of their journey. Pre-sale authors and published authors had fundamentally different priorities. We redesigned the dashboard to adapt based on lifecycle state:
- Pre-sale authors see campaign momentum first: units sold, days remaining, and progress toward the 150-book goal.
- Published authors see financial clarity first: royalties generated, available balance, multi-channel sales, and a visible “Request Royalties” action.
By aligning the information hierarchy with the author’s current goals, the dashboard became context-aware reducing confusion and making the next step obvious.
The dashboard structure adapts based on the author lifecycle state
Pre-sales author
Published author
Making Royalty Logic Understandable
Royalty percentages were contract-based and changed according to sales thresholds. The logic existed — but the dashboard did not explain it clearly. Authors saw numbers without understanding progression, eligibility, or timing. We redefined how royalties were presented by turning financial logic into a clear visual system. This reduced ambiguity and increased confidence in how earnings were calculated.
Visualizing Progression Instead of Just Percentages
Instead of showing static percentages, we introduced a royalty journey component that made progression tangible.
- Current tier clearly highlighted
- Next tier explicitly shown
- Number of books needed to unlock the next percentage
- Reinforcing microcopy to reduce uncertainty
Contractual royalty tiers translated into a clear progression system (for Pre-sales authors)
Separating Generated vs Available Earnings
One of the biggest sources of confusion was the difference between total royalties earned and royalties available for withdrawal. We introduced a clear structural distinction:
- Total Royalties (generated revenue)
- Royalties Available (withdrawable balance)
- Number of books needed to unlock the next percentage
This eliminated ambiguity around timing and payout conditions.
Contextualizing the “Request Royalties” Action
Previously, authors had to ask support how and when to withdraw their royalties. We introduced a contextual CTA:
- Visible only when publish conditions are met.
- Displays withdrawable amount directly
- Triggers a simplified one-click request flow
Action appears only when eligible, reducing friction and support dependency
Making Multi-Channel Revenue Transparent
Books generated revenue across multiple channels (Web, Amazon, Fnac, bookstores).
Previously, this logic was fragmented. We consolidated sales data into a clear visual breakdown:
- Channel-level distribution
- Monthly filtering
- Unified royalty accumulation logic
- Reinforcing microcopy to reduce uncertainty
Final Experience Overview
The redesigned dashboard delivers a structured, lifecycle-aware experience that adapts to the author’s stage while maintaining clarity and financial transparency. Pre-sale authors are guided by momentum and progress with campaign goals, days remaining, and sales performance prioritized visually. Published authors transition into a financially actionable view where royalties generated, available balance, multi-channel sales, and payout actions are clearly surfaced. The result is a dashboard that feels stable, trustworthy, and aligned with how authors actually experience their publishing journey.
Pre-sales Dashboard focuses on:
- Clear progress toward the 150-book publication goal.
- Time pressure visibility (days remaining).
- Weekly performance tracking to reinforce momentum.
- Royalty tier progression as motivational feedback.
- Sales breakdown to guide promotional decisions.
Pre-sale view prioritizing campaign momentum and publication goal
The dashboard adapts automatically based on the author's lifecycle stage, reshaping priorities from growth to financial management.
Published Dashboard focuses on:
- Immediate visibility of withdrawable royalties.
- Explicit separation of earned vs available balance.
- Multi-channel sales transparency (Web, Amazon, Fnac, bookstores).
- Historical tracking of liquidations and pending payments.
- Motivational tier system aligned with contractual royalty thresholds.
- Strategic CTA placement for royalty withdrawal.
Published view shifting focus toward royalties, multi-channel sales, and payout actions
Impact
The redesign did not only improve usability — it reduced operational friction and strengthened financial transparency across the platform.
Operational Impact
- Support tickets related to royalties and dashboard confusion decreased from ~50 to ~15 per month.
- Reduced dependency on account managers for royalty withdrawal clarification.
- Fewer manual explanations of contractual royalty thresholds
- Increased author autonomy in managing earnings
Financial & Product Impact
- Clear distinction between generated and available royalties reduced payout misunderstandings.
- Contextual “Request Royalties” action made withdrawal eligibility explicit, reducing reliance on support for payout clarification.
- Improved trust in multi-channel revenue tracking.
- Scalable dashboard architecture supporting platform growth across France, Spain, and LATAM.
Structural Impact
- Transition from legacy structure to a lifecycle-based adaptive system.
- Alignment between product logic and contractual revenue model.
- Foundation prepared for future feature expansion without structural rework.
Learnings
Redesigning the Author Dashboard reinforced the importance of aligning product structure with business logic and user lifecycle. A system may function technically, but if it does not reflect how users’ priorities evolve, friction and confusion emerge. Designing for lifecycle adaptation required stepping back from individual screens and thinking in terms of states, progression, and financial clarity.
Working within contractual royalty constraints also strengthened my ability to translate complex revenue logic into understandable, actionable interfaces. Transparency is not about exposing more data — it’s about structuring it in a way that builds confidence.
Finally, this project highlighted the impact of structural decisions. Choosing to rebuild rather than iterate allowed us to create a scalable foundation that reduced operational friction and better supported platform growth.
From complex Dashboards to Checkout flows, see the breadth of my Design Projects.
More projects
Product Design | In-house software | AI Prototyping
Internal Tool for Content Operations
View case study

JG
Work
About
Contact
JG
Work
About
Contact

UX/UI Design | Product Design
Building a Scalable B2B Dashboard for a Creator Publishing Platform
Designing a lifecycle-based dashboard for campaign performance and royalties, reducing confusion and operational friction for revenue partners.
↓ support tickets by 70%, lowering operational support load (50 → 15 per month)
Royalties system
Project overview
Product: Author Dashboard (Performance & Royalties)Company stage: Scale-upRole: UX/UI Designer — Lead DesignerPlatform: Web (Desktop-first usage)Status: Launched and iteratively improved
The project involved a full structural redesign of DashBook’s author dashboard — transforming a backend-driven interface into a scalable, lifecycle-based system focused on performance visibility, revenue clarity, and operational efficiency.
Product Context
DashBook was scaling from an early-stage startup into a multi-market publishing platform, managing 50+ active pre-sale campaigns and supporting over 200 published authors across France, Spain, and LATAM. Authors were not just users — they were revenue partners. The business depended on their ability to run successful campaigns, reach a 150-book publication threshold, and continue generating royalties across multiple sales channels once published.
The dashboard was the operational core of this journey. During pre-sales, authors tracked momentum toward publication. After launch, they relied on it to monitor sales performance, royalties, and payouts. As the platform grew, it became clear that a single static dashboard structure could no longer support two fundamentally different lifecycle stages.
Problem
The Dashboard Didn’t Reflect the Author Lifecycle
As the company scaled across France, Spain, and LATAM, the system remained structurally unchanged treating all authors the same, regardless of their lifecycle stage. However, these were fundamentally different product states:
- During pre-sales, authors were focused on reaching 150 books sold within 44 days. They seek for visibility, momentum, and clarity around their publication target.
- Once published, they shifted to monitoring royalties, sales channels, and withdrawal timing.
The interface did not adapt to these changing needs. As a result:
- Performance metrics and financial data were mixed without hierarchy.
- Royalties were visible but not clearly actionable.
- The contractual royalty thresholds were technically present but conceptually unclear.
- Required manual processes for royalties withdrawal.
- Authors frequently contacted support to understand when and how they could withdraw earnings.
The system was functional — but not strategically designed around the author journey.
A single static structure attempted to serve multiple author states without differentiation
My Role
I led the complete redesign and re-implementation of DashBook’s Author Dashboard, replacing the legacy system with a new React-based product foundation. This was not an incremental update — we intentionally removed low-value legacy features (such as Calendar and Manuscripts) to rebuild the system around clarity, scalability, and financial logic. Working closely with the PM and engineering team, we made the strategic decision to start from scratch. I redefined the information architecture, separated performance tracking from financial management, and introduced a clear lifecycle structure for pre-sale and published authors.
Research & Insights
Insights emerged from recurring author conversations and direct collaboration with Customer Support, Business Developers, and Editors teams in continuous contact with authors at every stage of their journey.
By analyzing support tickets and operational patterns, we identified repeated confusion around royalties, sales tracking, and payout procedures particularly once books transitioned from pre-sale to publication.
I found out something critical: The dashboard did not evolve with the author publishing cycle.
Key Observations
Author priorities shift depending on lifecycle stage
- Pre-sale authors focused on momentum and campaign progress.
- Published authors focused on financial clarity and payout control.
Royalty threshold system was contractually defined but visually abstract
Authors didn’t understand:
- Where they currently stood
- What was needed to reach the next tier
Static dashboards fail in dynamic business models
A single structure could not support campaign tracking, revenue thresholds, multi-channel royalties, and payout management simultaneously.
Manual royalty processes increased uncertainty
Authors often contacted internal teams to understand when and how to withdraw royalties, indicating a lack of actionable clarity within the product itself.
Core Insight
The issue was not missing data. It was the absence of a lifecycle-aware structure and revenue clarity.
The dashboard needed to:
- Adapt to the author’s state
- Clarify financial progression
- Reduce dependency on human support
- Increase trust in revenue transparency
Legacy dashboard treating all authors equally, regardless of lifecycle stage, and mixing performance and financial data without contextual prioritization.
Design Strategy
Rethinking the Dashboard from the Ground Up
The legacy dashboard had grown around technical decisions rather than author needs, resulting in a fragmented structure that mixed performance, royalties, and secondary features without clear priorities. Instead of iterating on top of those constraints, we rebuilt the dashboard from scratch using a new React-based foundation. We removed low-value legacy features and simplified the architecture to focus on what truly mattered: lifecycle clarity and revenue transparency. This reset allowed us to design a scalable, adaptive system aligned with the author journey and the business model behind it.
Designing an Adaptive Dashboard
A single static structure could not support authors at different stages of their journey. Pre-sale authors and published authors had fundamentally different priorities. We redesigned the dashboard to adapt based on lifecycle state:
- Pre-sale authors see campaign momentum first: units sold, days remaining, and progress toward the 150-book goal.
- Published authors see financial clarity first: royalties generated, available balance, multi-channel sales, and a visible “Request Royalties” action.
By aligning the information hierarchy with the author’s current goals, the dashboard became context-aware reducing confusion and making the next step obvious.
The dashboard structure adapts based on the author lifecycle state
Pre-sales author
Published author
Making Royalty Logic Understandable
Royalty percentages were contract-based and changed according to sales thresholds. The logic existed but the dashboard did not explain it clearly. Authors saw numbers without understanding progression, eligibility, or timing. We redefined how royalties were presented by turning financial logic into a clear visual system. This reduced ambiguity and increased confidence in how earnings were calculated.
Visualizing Progression Instead of Just Percentages
Instead of showing static percentages, we introduced a royalty journey component that made progression tangible.
- Current tier clearly highlighted
- Next tier explicitly shown
- Number of books needed to unlock the next percentage
- Reinforcing microcopy to reduce uncertainty
Contractual royalty tiers translated into a clear progression system (for Pre-sales authors)
Separating Generated vs Available Earnings
One of the biggest sources of confusion was the difference between total royalties earned and royalties available for withdrawal. We introduced a clear structural distinction:
- Total Royalties (generated revenue)
- Royalties Available (withdrawable balance)
- Number of books needed to unlock the next percentage
This eliminated ambiguity around timing and payout conditions.
Contextualizing the “Request Royalties” Action
Previously, authors had to ask support how and when to withdraw their royalties. We introduced a contextual CTA:
- Visible only when publish conditions are met.
- Displays withdrawable amount directly
- Triggers a simplified one-click request flow
Action appears only when eligible, reducing friction and support dependency

Making Multi-Channel Revenue Transparent
Books generated revenue across multiple channels (Web, Amazon, Fnac, bookstores).
Previously, this logic was fragmented. We consolidated sales data into a clear visual breakdown:
- Channel-level distribution
- Monthly filtering
- Unified royalty accumulation logic
- Reinforcing microcopy to reduce uncertainty
Final Experience Overview
The redesigned dashboard delivers a structured, lifecycle-aware experience that adapts to the author’s stage while maintaining clarity and financial transparency. Pre-sale authors are guided by momentum and progress with campaign goals, days remaining, and sales performance prioritized visually. Published authors transition into a financially actionable view where royalties generated, available balance, multi-channel sales, and payout actions are clearly surfaced. The result is a dashboard that feels stable, trustworthy, and aligned with how authors actually experience their publishing journey.
Pre-sales Dashboard focuses on:
- Clear progress toward the 150-book publication goal.
- Time pressure visibility (days remaining).
- Weekly performance tracking to reinforce momentum.
- Royalty tier progression as motivational feedback.
- Sales breakdown to guide promotional decisions.
Pre-sale view prioritizing campaign momentum and publication goal
The dashboard adapts automatically based on the author's lifecycle stage, reshaping priorities from growth to financial management.
Published Dashboard focuses on:
- Immediate visibility of withdrawable royalties.
- Explicit separation of earned vs available balance.
- Multi-channel sales transparency (Web, Amazon, Fnac, bookstores).
- Historical tracking of liquidations and pending payments.
- Motivational tier system aligned with contractual royalty thresholds.
- Strategic CTA placement for royalty withdrawal.
Published view shifting focus toward royalties, multi-channel sales, and payout actions

Impact
The redesign did not only improve usability — it reduced operational friction and strengthened financial transparency across the platform.
Operational Impact
- Support tickets related to royalties and dashboard confusion decreased from 50 to 15 per month.
- Reduced dependency on account managers for royalty withdrawal clarification.
- Fewer manual explanations of contractual royalty thresholds
- Increased author autonomy in managing earnings
Financial & Product Impact
- Clear distinction between generated and available royalties reduced payout misunderstandings.
- Contextual “Request Royalties” action made withdrawal eligibility explicit, reducing reliance on support for payout clarification.
- Improved trust in multi-channel revenue tracking.
- Scalable dashboard architecture supporting platform growth across France, Spain, and LATAM.
Structural Impact
- Transition from legacy structure to a lifecycle-based adaptive system.
- Alignment between product logic and contractual revenue model.
- Foundation prepared for future feature expansion without structural rework.
Learnings
Redesigning the Author Dashboard reinforced the importance of aligning product structure with business logic and user lifecycle. A system may function technically, but if it does not reflect how users’ priorities evolve, friction and confusion emerge. Designing for lifecycle adaptation required stepping back from individual screens and thinking in terms of states, progression, and financial clarity.
Working within contractual royalty constraints also strengthened my ability to translate complex revenue logic into understandable, actionable interfaces. Transparency is not about exposing more data — it’s about structuring it in a way that builds confidence.
Finally, this project highlighted the impact of structural decisions. Choosing to rebuild rather than iterate allowed us to create a scalable foundation that reduced operational friction and better supported platform growth.
From complex Dashboards to Checkout flows, see the breadth of my Design Projects.
More projects
Product Design | In-house software | AI Prototyping
Internal Tool for Content Operations
View case study